| front |1 |2 |3 |4 |5 |6 |7 |8 |9 |10 |11 |12 |13 |14 |15 |16 |17 |18 |19 |20 |21 |22 |23 |24 |25 |26 | 27|28 |29 |30 |31 |32 |33 |34 |35 |36 |37 |38 |39 |40 |41 |review |
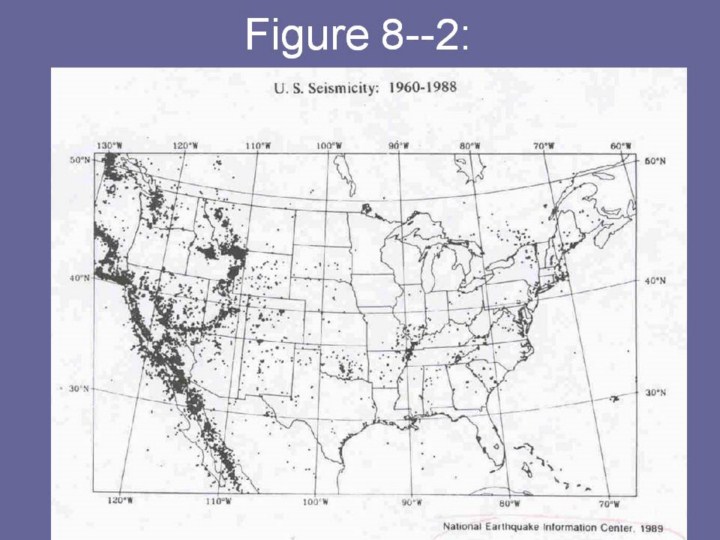 |
美国地震活性图。这幅美国地质调查图显示了在美国大陆发生地质的危险因素。黑点表示从1960年到1988年地震活跃的地区。来自于国家地震信息中心,1989年 |