 |
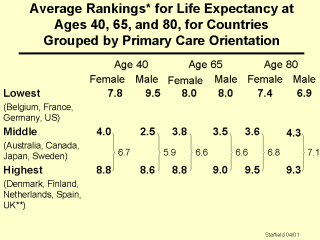
*Best level of health indicator is ranked 1; worst is ranked 13,
thus, lower average ranks indicate better performance.**England and Wales only
Average rankings for life expectancy at older ages are
best in the middle group of countries, and better in the combined middle and best primary
care oriented countries than in the countries that are poorly oriented to primary care.
The advantage of the good primary care countries is reduced in the oldest age groups,
perhaps due to the higher expenditures in the poor primary care countries on life-saving
technology at ages over 65 and especially at over age 80. |