| front |1 |2 |3 |4 |5 |6 |7 |8 |9 |10 |11 |12 |13 |14 |15 |16 |17 |18 |19 |20 |21 |22 |23 |24 |25 |26 |27 |28 |29 |30 |31 |32 |33 |34 |35 |36 |37 |38 |review |
 |
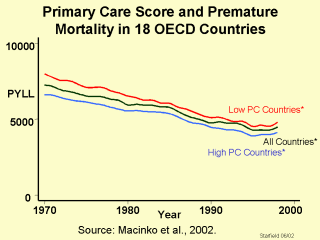
*Predicted PYLL (both genders) estimated by fixed effects,
using pooled cross-sectional time series design. Analysis controlled for GDP, percent
elderly, doctors/capita, average income (ppp), alcohol and tobacco use. R2(within)=0.77. The relationship between the strength of primary care and health outcomes is consistent over time, as shown in the graph of premature mortality from 1970 to the late 1990s. Source: Macinko JA, Starfield B, Shi L. The contribution of primary care systems to health outcomes within Organization for Economic Cooperation and Development (OECD) countries, 1970-1998. Submitted 2002. |