Search inside of Supercourse and lectures in HTML and PPT format
| front |1 |2 |3 |4 |5 |6 |7 |8 |9 |10 |11 |12 |13 |14 |15 |16 |17 |18 |19 |20 |21 |22 |23 |24 | 25|26 |27 |28 |29 |30 |31 |32 |33 |34 |35 |36 |37 |38 |39 |40 |41 |42 |43 |44 |45 |46 |47 |48 |49 |50 |51 |52 |53 |54 |55 |56 |57 |58 |59 |60 |61 |62 |review |
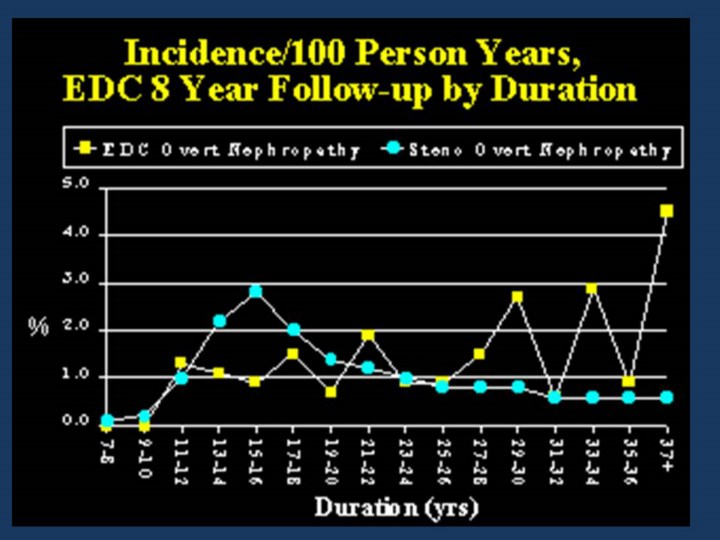 |
This slide contrasts the current EDC incidence curve for nephropathy to that seen previously in the Steno Clinic. As can be seen the original, early, Steno peak has now disappeared and is not seen in the Pittsburgh data, but rather peaks are appearing at long duration of diabetes when previously in Steno there was no incidence peak. These changes are likely to reflect the improved glycemic, blood pressure, and possibly lipid control in the more recent years. |