Search inside of Supercourse and lectures in HTML and PPT format
 |
 |
front |1 |2 |3 |4 |5 |6 |7 |8 |9 |10 |11 |12 |13 |14 |15 |16 |17 |18 |19 |20 |21 |22 |23 |24 |25 |26 |27 |28 |29 |30 |31 |32 |33 |34 |35 |36 |37 |38 |39 |40 |41 |42 |43 |44 |45 |46 |47 |48 |49 |50 |51 |52 |53 |54 |55 |56 |57 |58 |59 |60 |61 |62 |review |
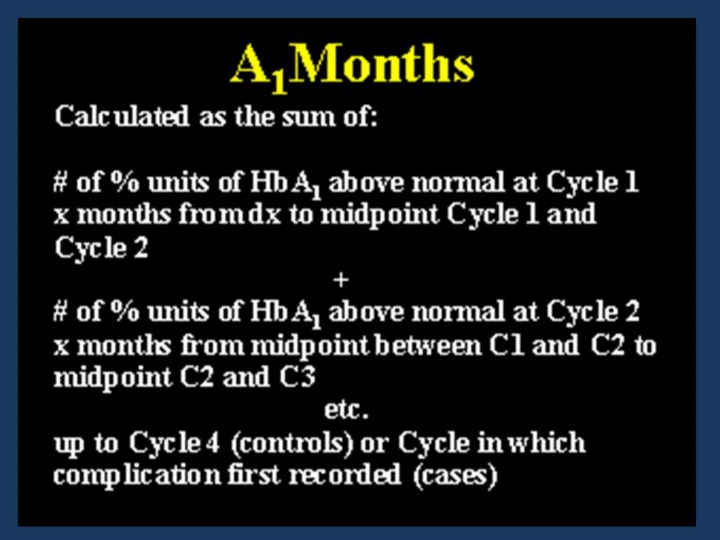 This cumulative glycemic exposure variable was calculated by taking the number of HbA1 (or A1c) units above normal at the first measurement (in the EDC study this was Cycle 1) and multiplying it by the number of months from diagnosis to the midpoint between the first and second measurements of HbA1. This product was then added to the number of units above normal at the second measurement (Cycle 2 in EDC) times the number of months between the first and second measurement and the second and third measurement, i.e. the midpoint between measurements. This process is then repeated until either the complication has developed or the end of follow-up. Having calculated this number of A1months one can then examine as to whether the amount of glycemic exposure experienced at the development of complications is consistent by duration, age or other factors. |
|