| front |1 |2 |3 |4 |5 |6 |7 |8 |9 |10 |11 |12 |13 |14 |15 |16 |17 |18 |19 |20 |21 |22 |23 |24 |25 |26 |27 |28 |review |
 |
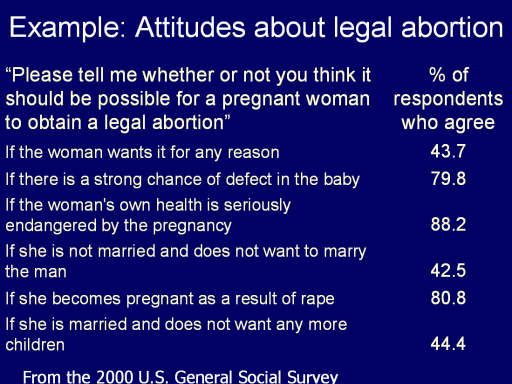
This table presents
statistics on the percentage of respondents who agree that abortion
should be legal under each of six circumstances. The items are
arranged in the rows in the same order as on the questionnaire of
the 2000 U.S. General Social Survey.
|