| front |1 |2 |3 |4 |5 |6 |7 |8 |9 |10 |11 |12 |13 |14 |15 |16 |17 |18 |19 |20 |21 |22 |23 |24 |25 |26 |27 |28 |review |
 |
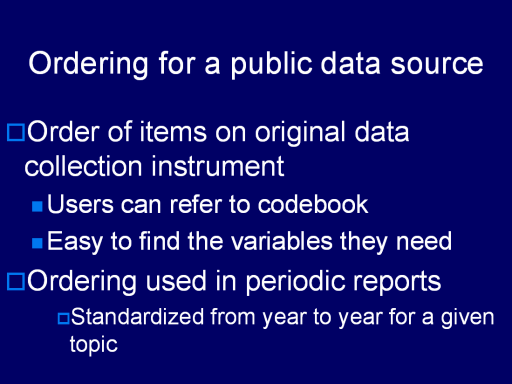
To organize data in tables
and charts that are intended principally as published sources from
which others will collect data, investigate which of these two
principles is most commonly used for your data source and topic. One
approach is to organize the information in the same order as found
on the original data collection instrument, making it
straightforward to find specific variables by consulting the
codebook, questionnaire, or other form used to collect the data.
Another possibility often
used in periodic reports on a specific topic is to maintain the same
order of items across years or across geographic units. Many Census
and NCHS reports use the latter approach.
|