| front |1 |2 |3 |4 |5 |6 |7 |8 |9 |10 |11 |12 |13 |14 |15 |16 |17 |18 |19 |20 |21 |22 |23 |24 |25 |26 |27 |28 |29 |30 |31 |32 |33 |review |
 |
HIV
prevalence is estimated in developing countries from HIV
serologic data and estimates of annual new HIV infections (HIV
incidence) and annual AIDS cases and deaths by modeling. Such
modeling relies on accurate HIV prevalence estimates and on the
median progression interval of about 8-9 years from HIV
infection to AIDS and death.
A major error in modeling annual HIV incidence and AIDS
is where on the HIV epidemic curve the current year is placed.
When the current year is from 5 to 10 years past the peak HIV
incidence period, annual HIV incidence will have been gradually
decreasing and AIDS cases and deaths increasing until annual
AIDS deaths become greater than annual HIV incidence.
In mid-2006, UNAIDS was forced to admit that globally,
HIV incidence peaked by the late 1990s.
Virtually all global regions have been in the post-peak
phase of their HIV epidemics for at least 6-7 years or longer
and modeled annual HIV incidence and AIDS deaths should either
be about equal or annual AIDS deaths should be greater than
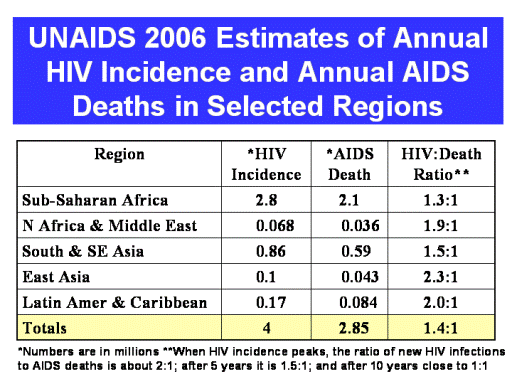
annual HIV incidence. This table presents UNAIDSí 2006 estimates
of annual HIV incidence and annual AIDS deaths in selected
global regions. UNAIDSí most current modeling of HIV incidence
and AIDS deaths has apparently not placed the year 2006 at 5-10
years after the post-peak part of their HIV epidemic curves
since its estimated annual HIV incidence continues to far exceed
annual AIDS deaths.
|