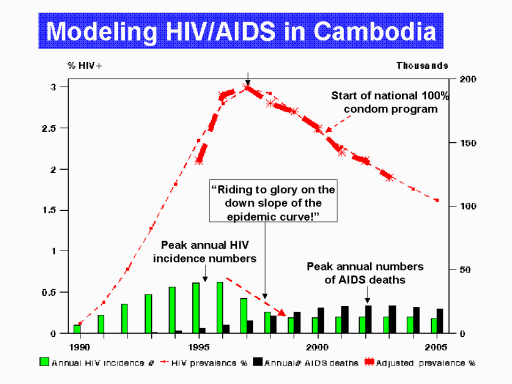
This figure shows the
estimated HIV prevalence trends in Cambodia and the modeled annual
HIV incidence that provides the best approximation of the HIV
prevalence curve. According
to the collected HIV data, HIV prevalence peaked in 1997 and has
been decreasing since then.
The modeled annual HIV incidence needed to “fit” the HIV prevalence
curve peaked between 1995 and 1996 and was relatively low by 1999.
WHO supported a national 100% condom program for FSW starting
in the year 2000 and has concluded that this condom program was
instrumental in the successful national HIV prevention program.
I’m sure that the WHO program was not responsible for the
observed decline in Cambodia’s HIV prevalence decrease but it is
hard to convince WHO of this.