| front |1 |2 |3 |4 |5 |6 |7 |8 |9 |10 |11 |12 |13 |14 |15 |16 |17 |18 |19 |20 |21 |22 |23 |24 |25 |26 |27 |28 |29 |30 |31 |32 |33 |review |
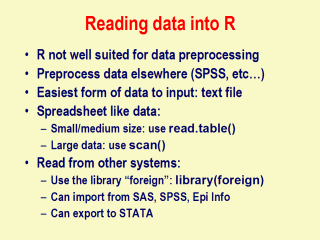 |
This is the absolute
first step of working with R when you want to do statistical data analysis.
You may not use this step if you are want to write a program yourself, say,
or if you are planning to enter some data yourself. We recommend that you
preprocess or "clean" the data elsewhere, using a spreadsheet program (e.g.
Microsoft Excel, or OpenOffice Calc), or another software like SPSS, or SAS,
and then import into R. However, you can use R to clean and preprocess data,
but that may take a longer time than doing preprocessing elsewhere. We
recommend that as a beginner, the best way to read data into R is use
"scan", or read.table() functions. Use ?read.table or ?scan within R to
learn more about them. Try to convert data into a text file and then input
into R. You can use the "foreign" library to import data from other
statistical systems (eg SPSS, or Epi Info). If you are working with
datasets, use the function "data.frame" or "as.data.frame" for converting
your dataset into a dataframe. For example, a typical command could run
like: library(foreign) mydata <- data.frame(read.spss("myfile.sav",use.value.labels=TRUE)) Here, you call the library "foreign" so that you can read data that is stored in a foreign format. Then store that data in the object called "mydata". You have to remember that you need to give full path of the file that is read in. In this example, the data file was in the same folder as the working directory of R. Once you have obtained a data frame, you can export it to different file formats. We prefer exporting it to a comma separated or tab delimited file for ease of use. Use the function "write.table" to accomplish the task. See ?write.table in an R session for more information. |