 |
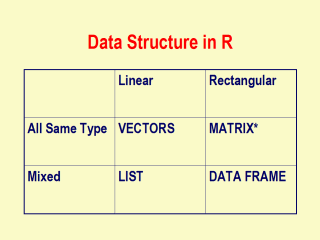
Loosely, this figure
shows an organization of data structures in R. Vectors are one dimensional,
for instance names, matrix are two dimensional, for instance simple time
series. List is a combination of different types of data, for instance an
object like a regression output coerced into a single dimension, and a data
frame is one like a large dataset. Thus, each column in a datset is an
example of a vector. A row in a large dataset is an example of a list.
*One can have "mixed", often called non-atomic in R, matrices such as:
matrix(list(1,"a",1+2i,TRUE),2,2)
[Source: Grothendiek, G (personal communication)] |
