| front |1 |2 |3 |4 |5 |6 |7 |8 |9 |10 |11 |12 |13 |review |
 |
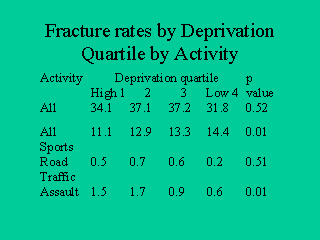
This slide shows the fracture rates by deprivation quartile for all fractures, all sports related fractures, road traffic related fractures, and those caused by assaults. The high deprivation quartile refers to the most deprived quartile with a Townsend score of 6.3 in the earlier slide. |