![]()

![]()
home
::: about
::: news
::: links
::: giving
::: contact
![]()
events
::: calendar
::: lunchtime
::: annual
lecture series
::: conferences
![]()
people
::: visiting fellows
::: postdoc fellows
::: resident fellows
::: associates
![]()
joining
::: visiting fellowships
::: postdoc fellowships
::: senior fellowships
::: resident fellowships
::: associateships
![]()
being here
::: visiting
::: the last donut
::: photo album
|
|
Senior Visiting Fellow Conference:
Diagrams As Vehicles of Scientific Inquiry
April 10-12, 2015
Traditional philosophy of science—-that is, the philosophy of science that flourished for a few brief moments when Hempel met a half century ago with his students—-is text heavy. More precisely, propositions, sentences and the logical relations among them were the basic structures out of which everything was built.
When one works in this mode, it is easy to overlook the figures and diagrams that appear in science. They might just be decorations introduced to relieve the tedium of pure text, like illustrations in a children’s book. Or perhaps they are concessions to the weakness of our mental powers. Diagrams might aid us in picturing the true relations. But they are just training wheels to be discarded when our minds develop a mature grasp of the material.
It is easy to imagine that, once, this was how a few in philosophy of science thought. It is harder to imagine that it was a mainstream of thought, even though a mass of journal publication shows otherwise. For diagrams are pervasive in the practice of virtually every science. The idea of a scientist without a blackboard covered in squiggles is like a . . . well, logical positivist without a truth table.
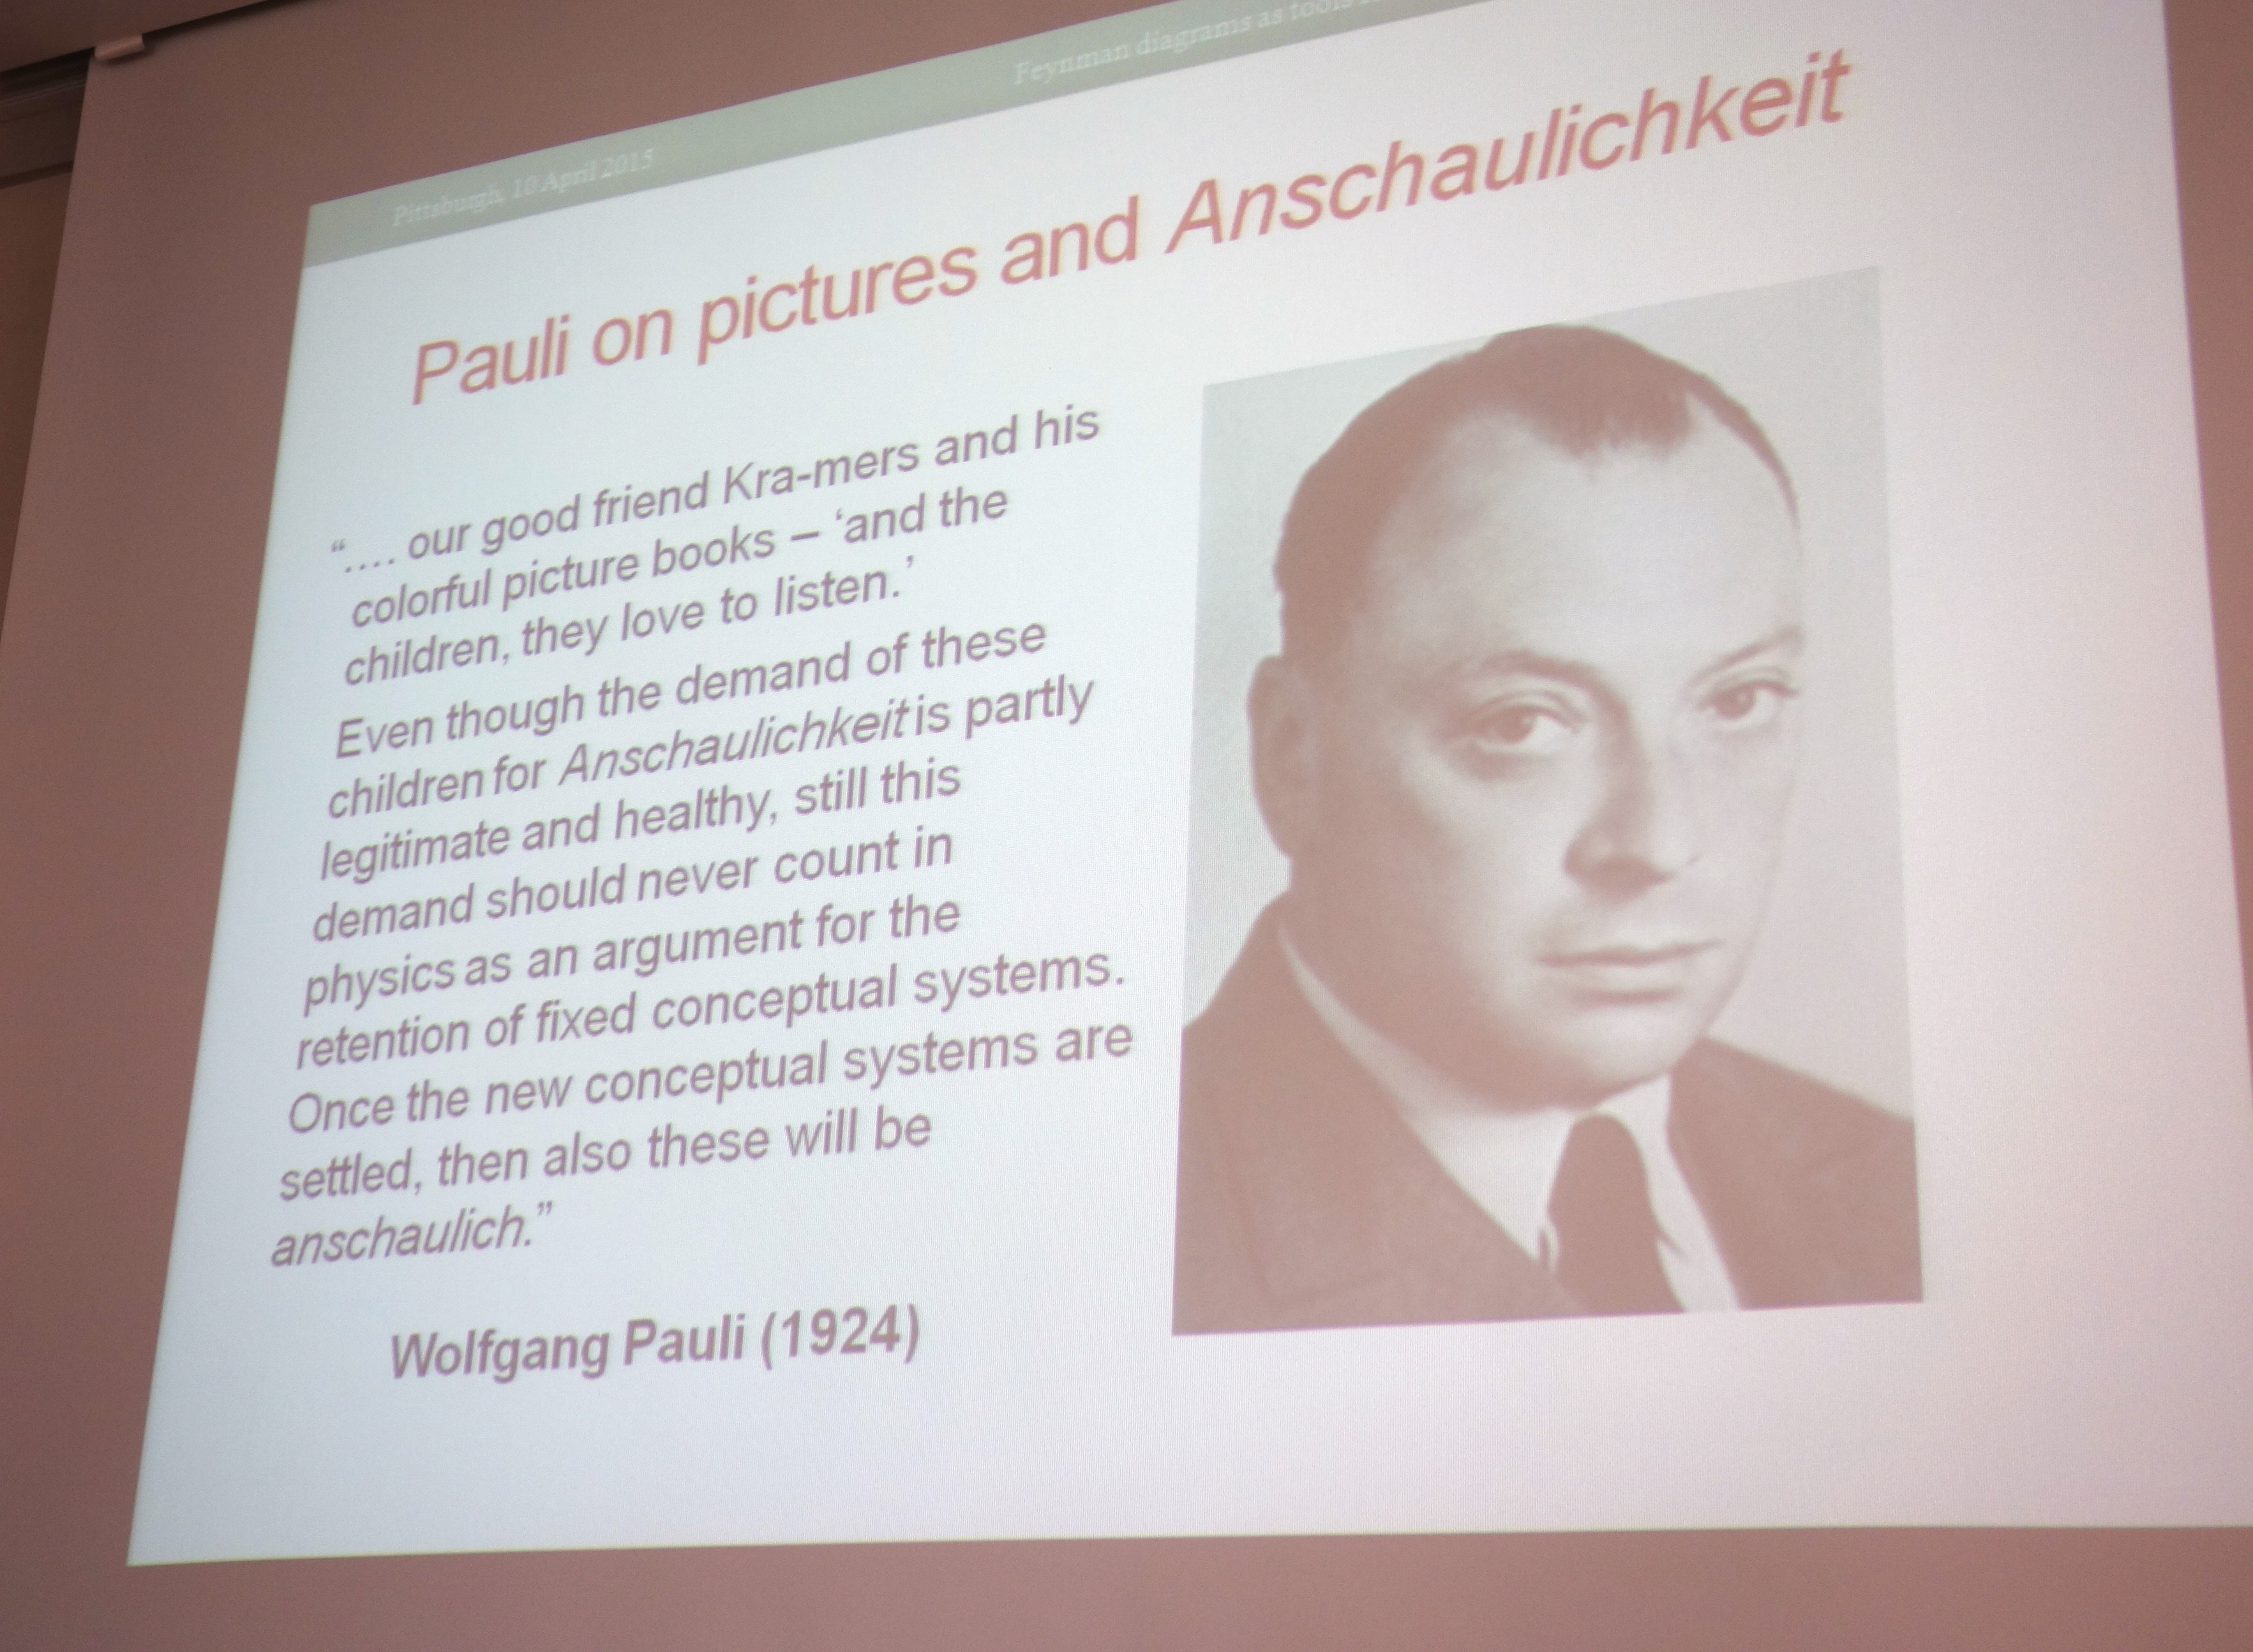
Jumping ahead, Henk de Regt has supplied a lovely illustration of the dismissal of visualization by Wolfgang Pauli in the context of early quantum theory. It is, Pauli avowed, akin to the childish love of picture books.
Over the past few decades, there has been a persistent and growing literature that has tried to remedy this neglect of diagrams in philosophy of science. The interest in the topic has now grown to the point that it can support energetic conferences.
Each year, our Senior Visiting Fellow is asked to organize a conference on any topic of his or her choice. This year, Bill Bechtel is our Senior Visiting Fellow and his choice is diagrams. More precisely, it is “Diagrams as Vehicles of Scientific Reasoning.”

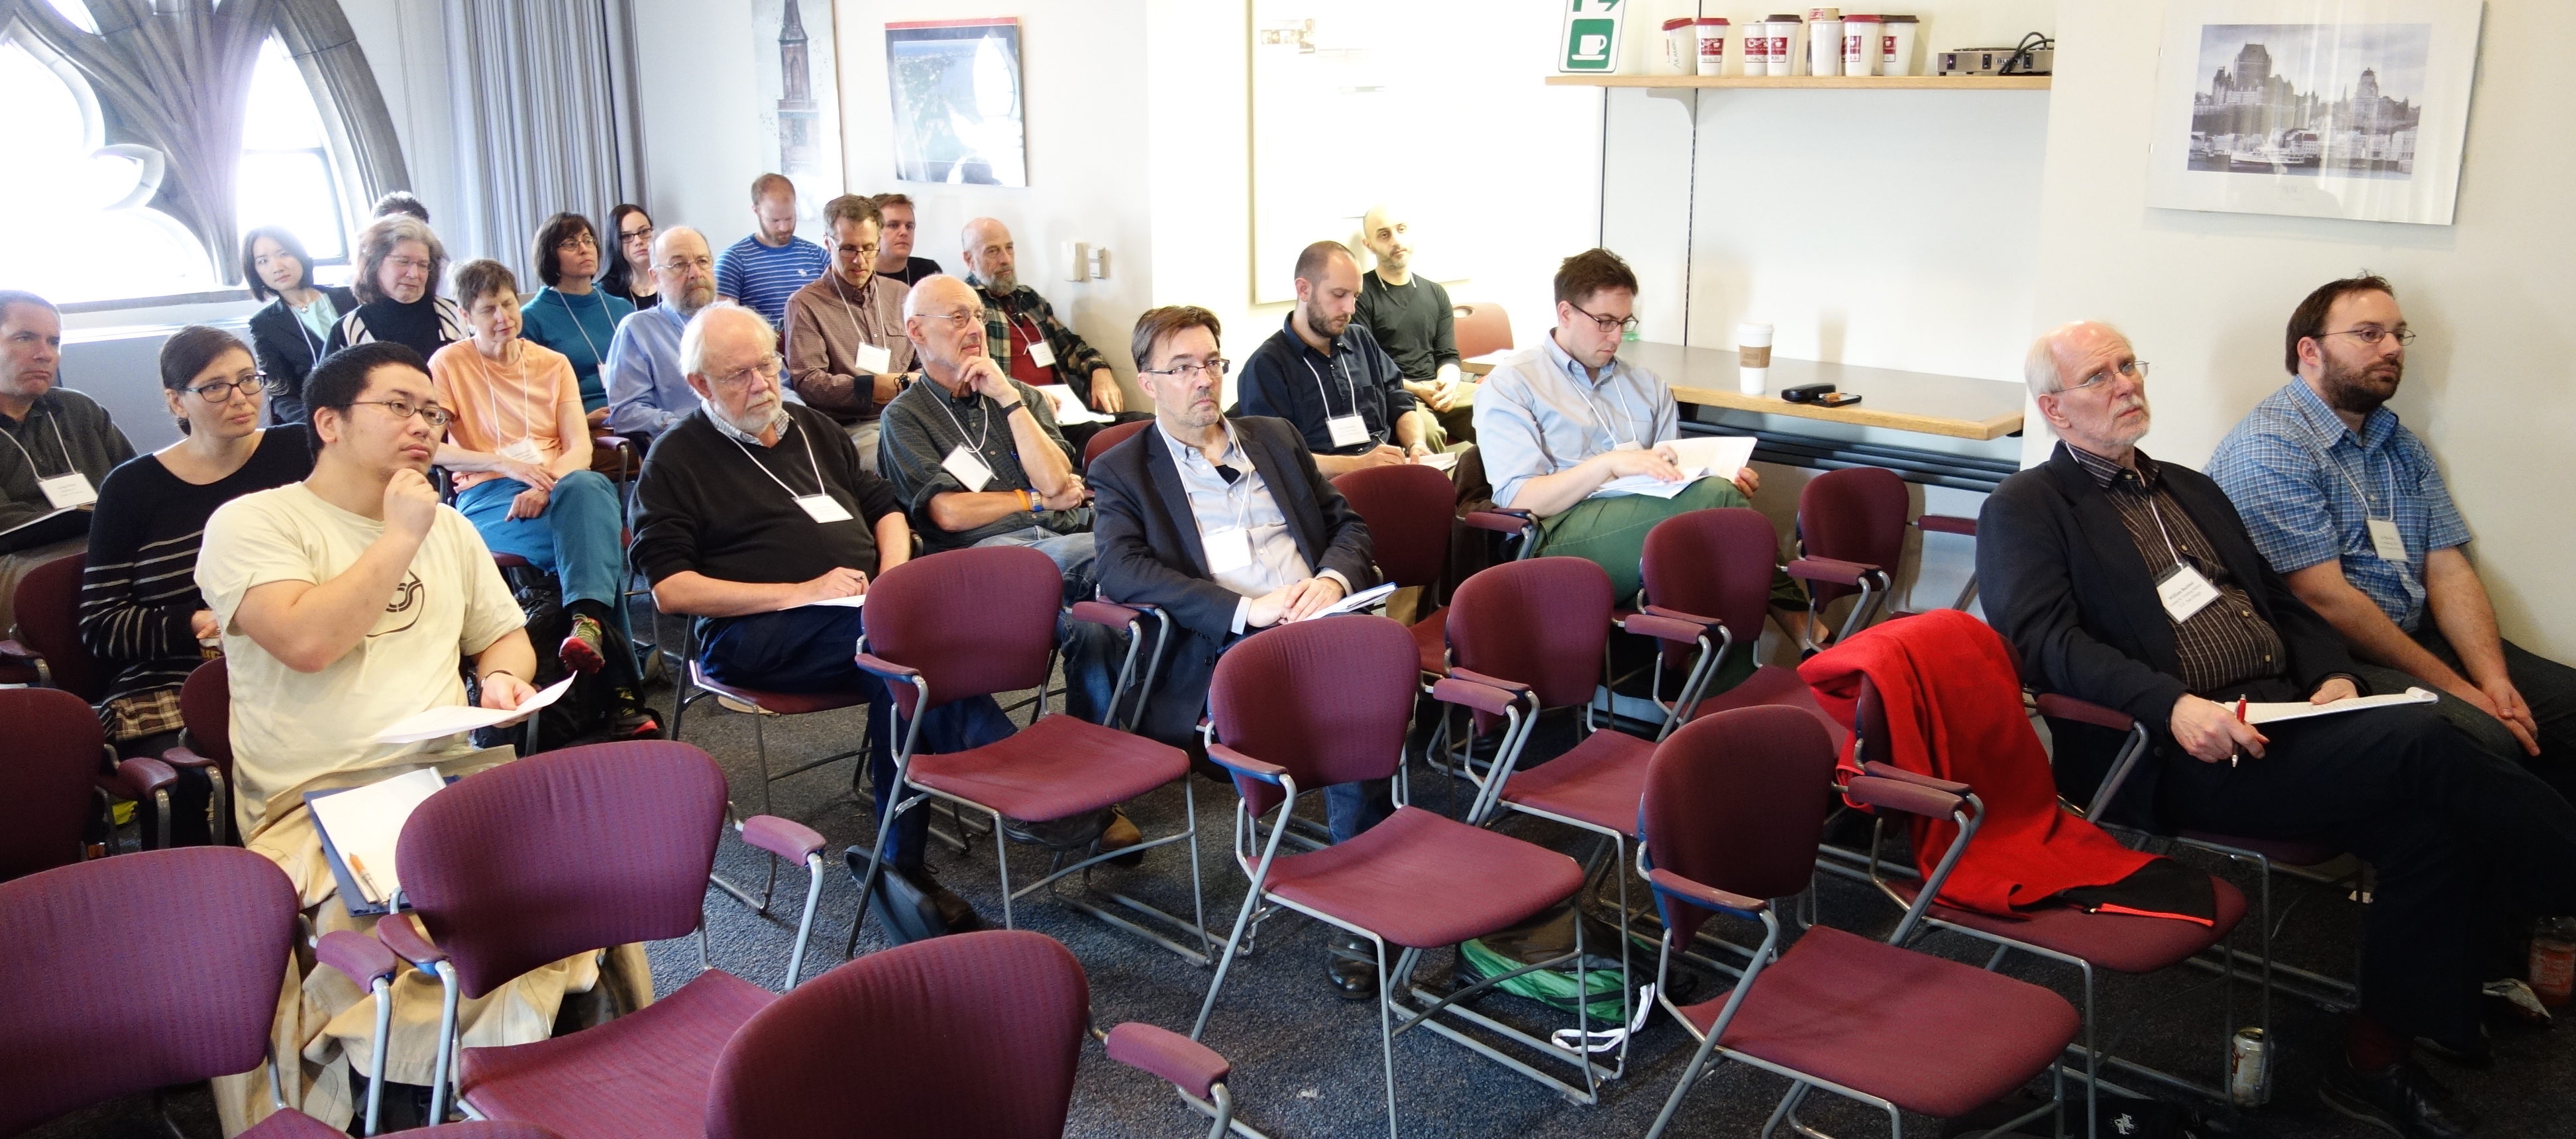
As the conference approached, I could see that this would be one of the more energetic conferences. It is an open call conference. The combination of Bill’s invited talks and the strong contributed talks made the program enticing and impressive. This was not just my impression. It seemed to be a fairly widely held viewpoint. We ask non-speakers to register so we can keep track of attendance. As the conference neared, I noticed some prominent philosophers of science were finding theconference enticing enough to want to make the trip to Pittsburgh.
What can a philosopher of science say about diagrams in science? They feature so prominently in science and even in my own in philosophy of science that there are too many possibilities.
There is always the psychological component. Our human visual systems are highly developed and can bring massive amounts of information into our consciousness in a compact and useful form. Darwin famously wrote in his notebook, “I think . . .” and what followed was a celebrated tree diagram:
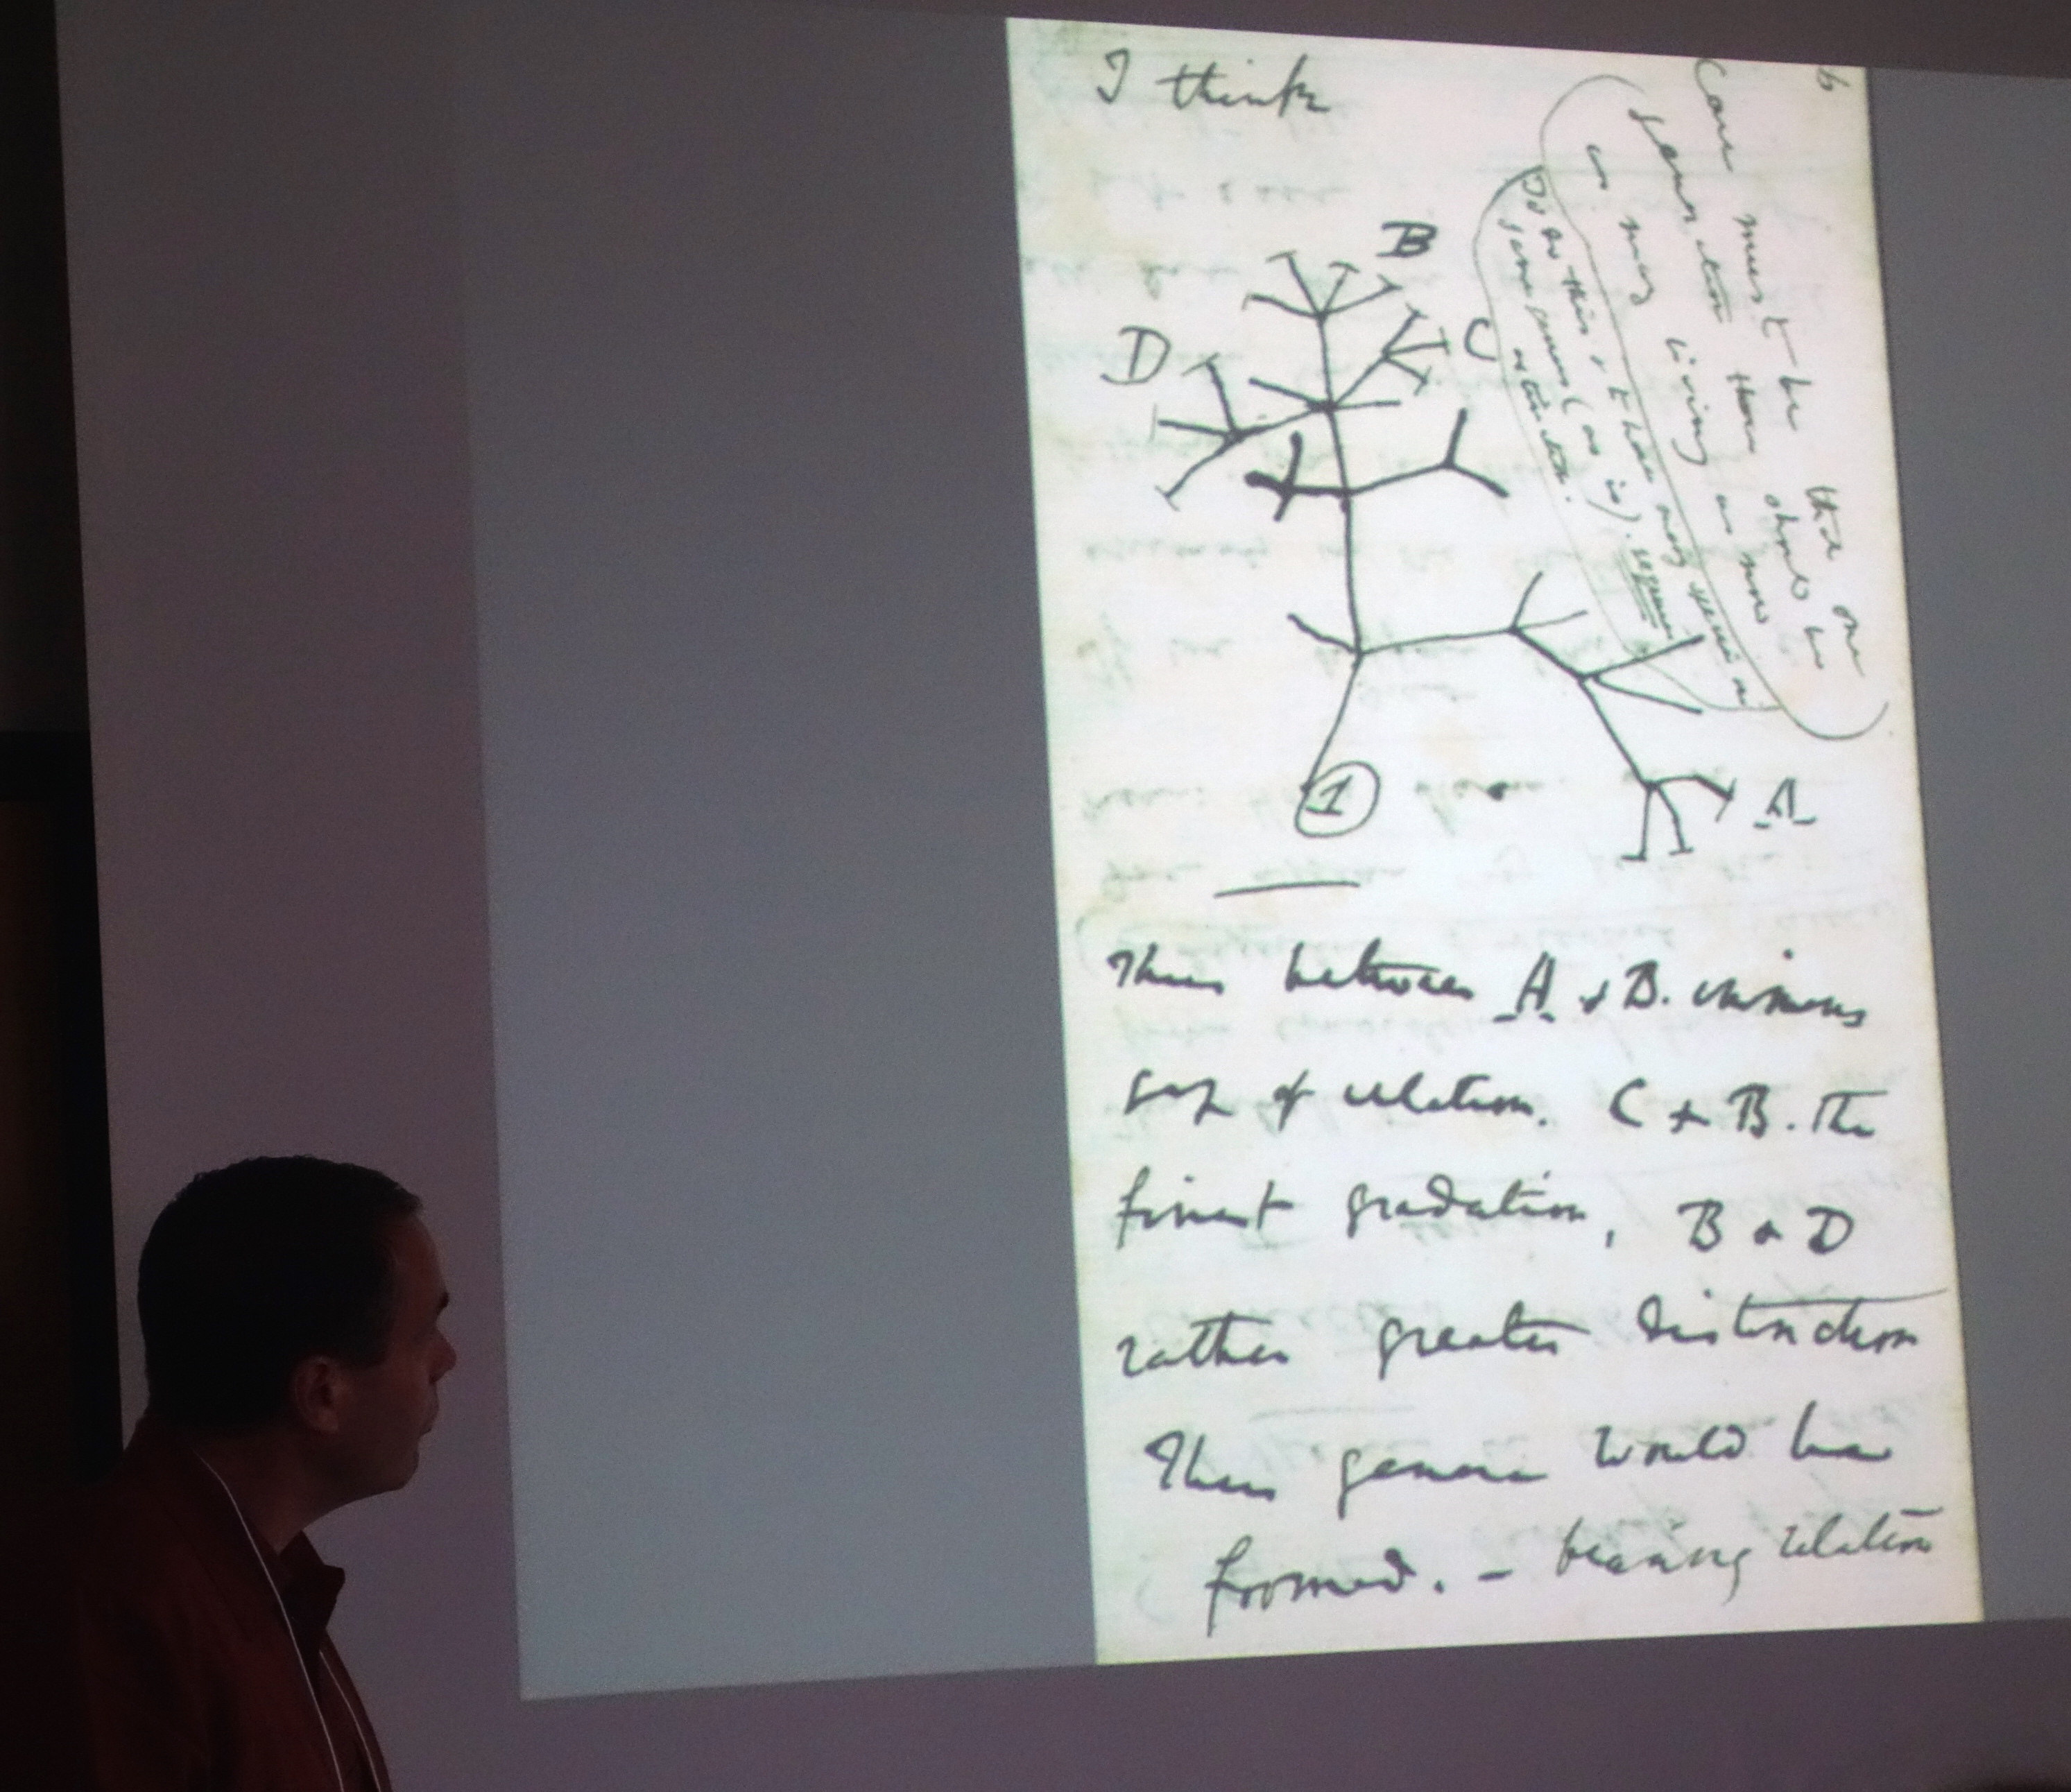
This from Greg Priest’s talk “Charles Darwin’s ‘Tree of Life’ Diagram as a Model of Evolutionary Processes"
Through this faculty, diagrams have an almost unique power to make things intelligible to us and to bring us understanding. Here is the harder philosophical question: is this effect purely a matter of psychology? Are they just training wheels? Or is there a deeper matter of principle at issue?
We can press on. An experiment gives us a mass of data. We employ a statistical algorithm to find the function that best fits the data. We crunch the numbers in some statistical package. It gives us the answer; and then further statistics on just how well that function performs in capturing the data.
No matter how detailed those statistics, I am always slightly alienated from the result until I do what everyone does or should do: plot the data and draw the function as a curve. Then you can see just what the result is and just how closely the curve comes to the data.
In this case, the diagram is not the essential thing. It might alert me to the possibility of some mismatch of the curve and data. If I find such a mismatch, the next step is to redo the statistical analysis in a way that repairs the defect. I may redraw the modified result just to be sure that things are right. But it is the statistical algorithm that is in control.
This sort of case is not the sort that interests me most. I want cases in which the diagrammatic reasoning is the authority and arbiter. That is what I hoped Bill’s conference would provide. He did put “scientific reasoning” in the title.

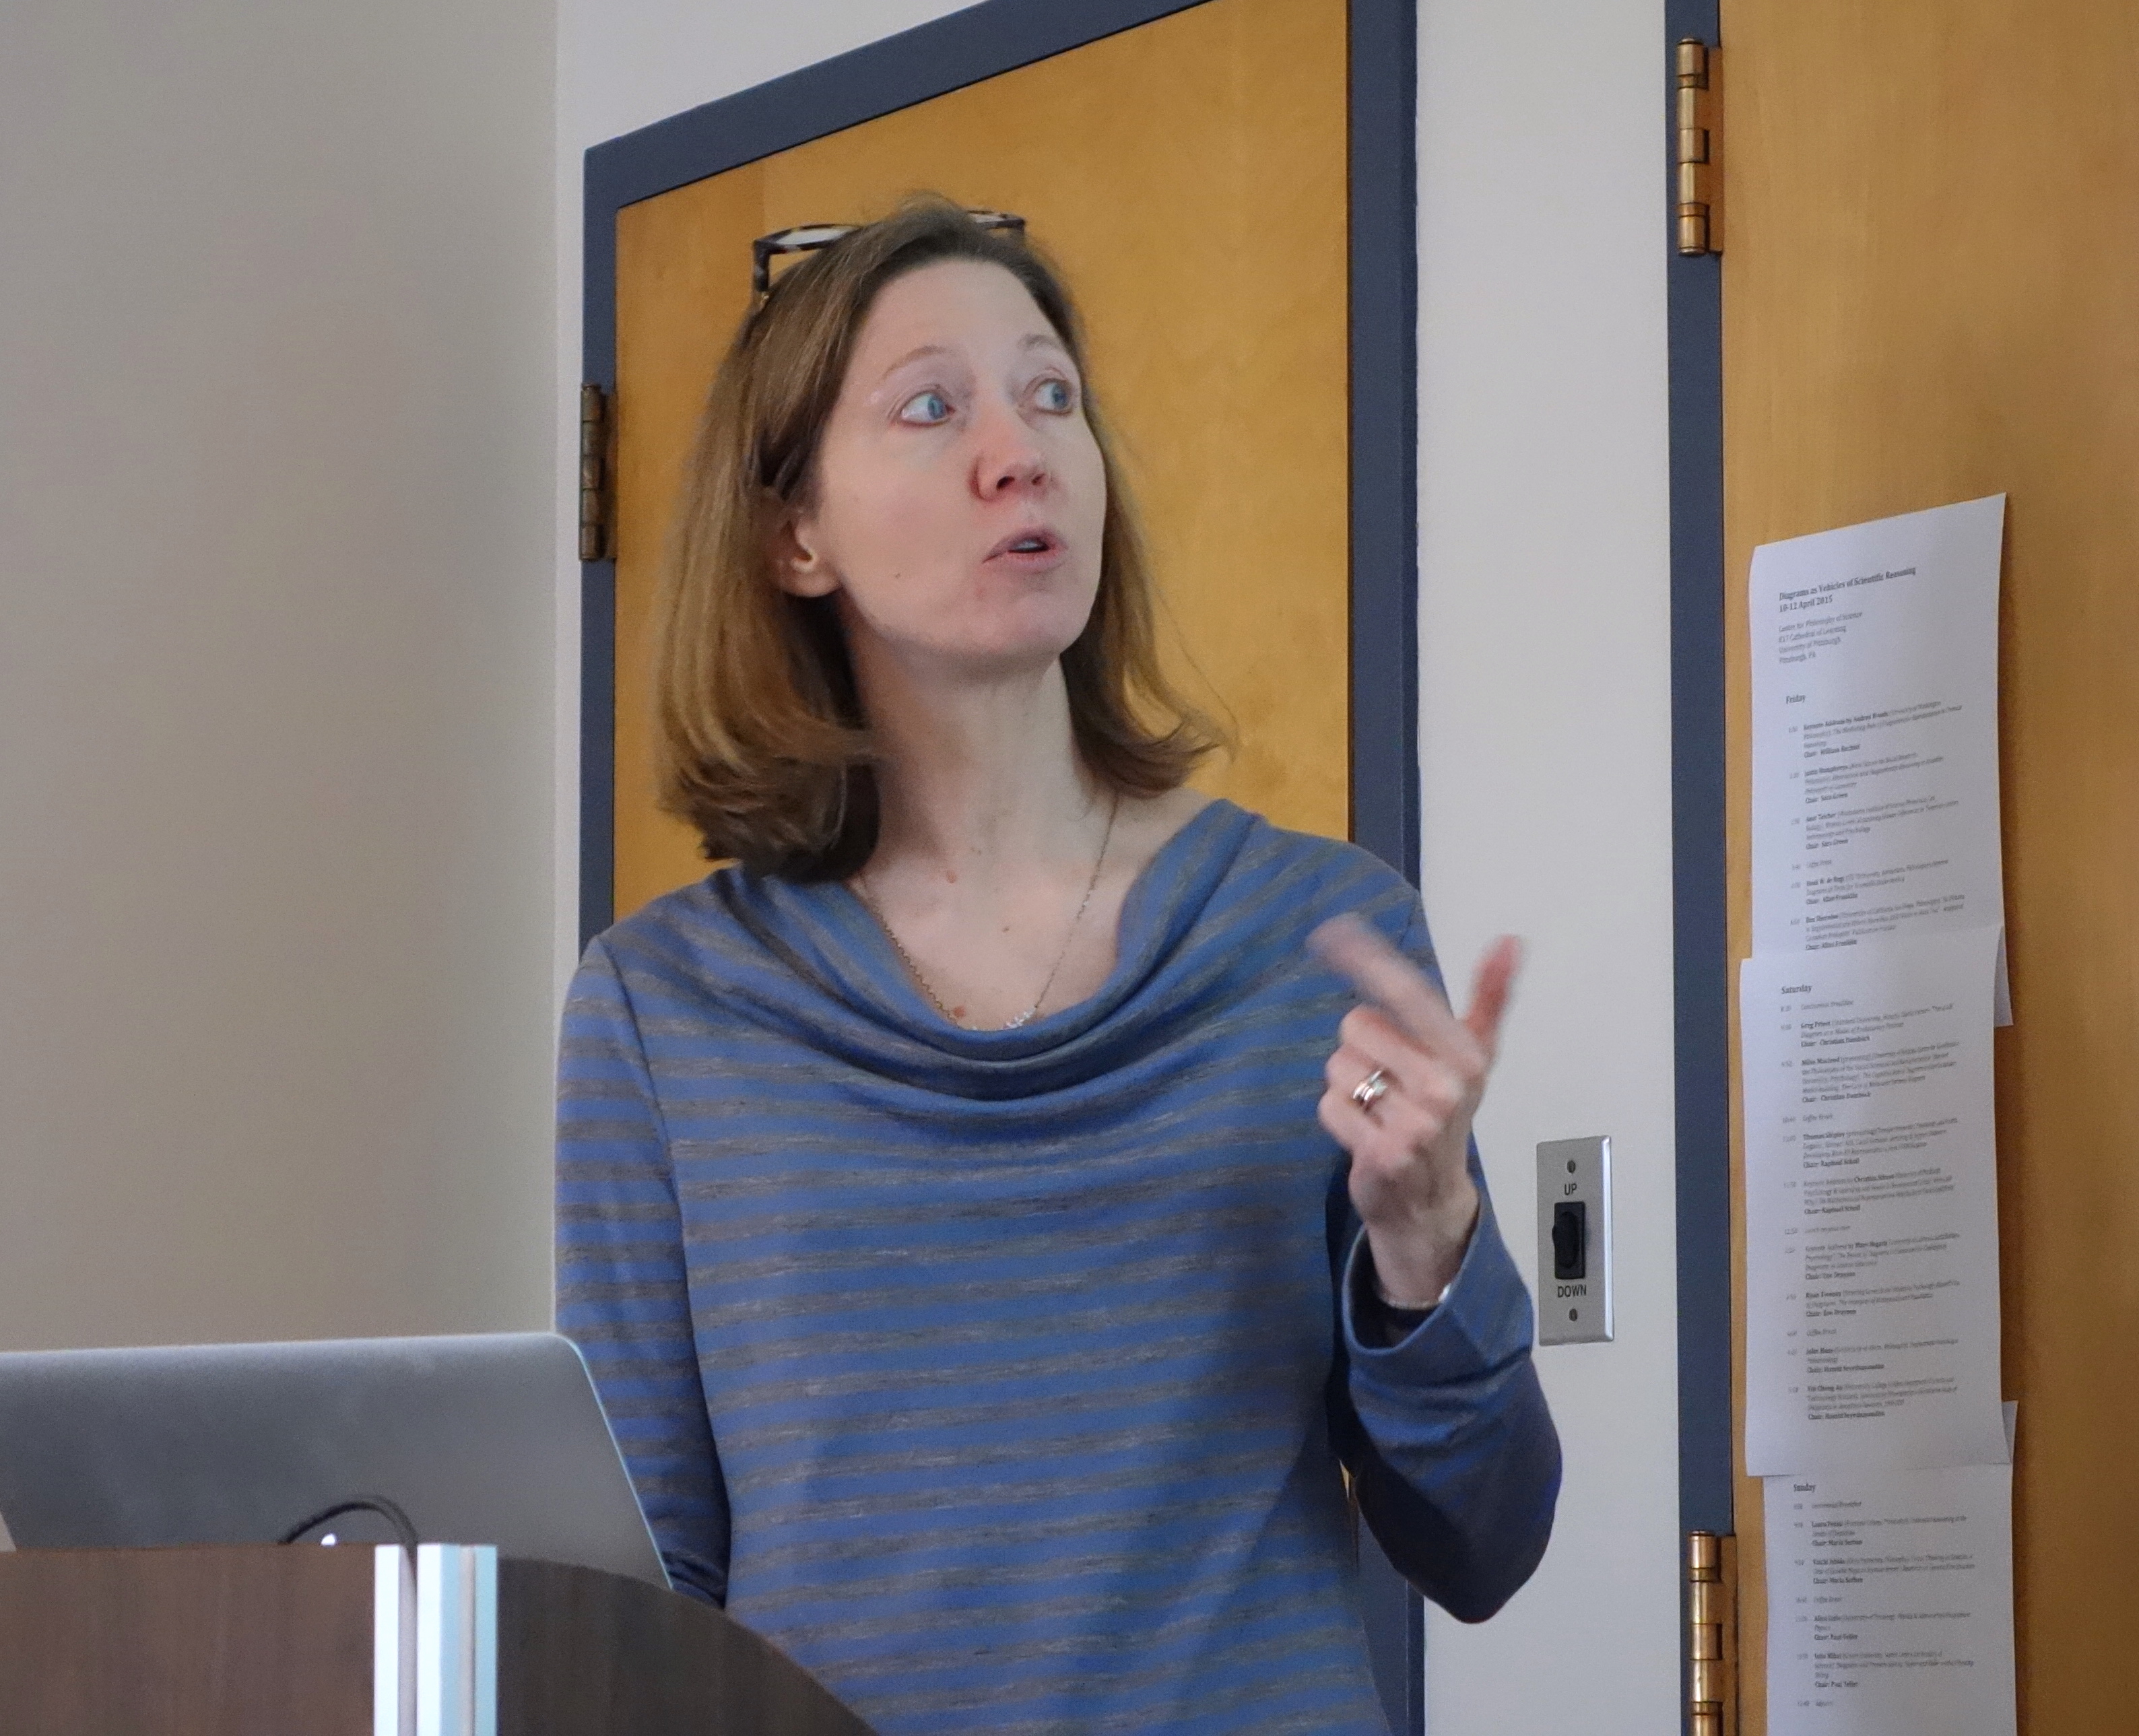
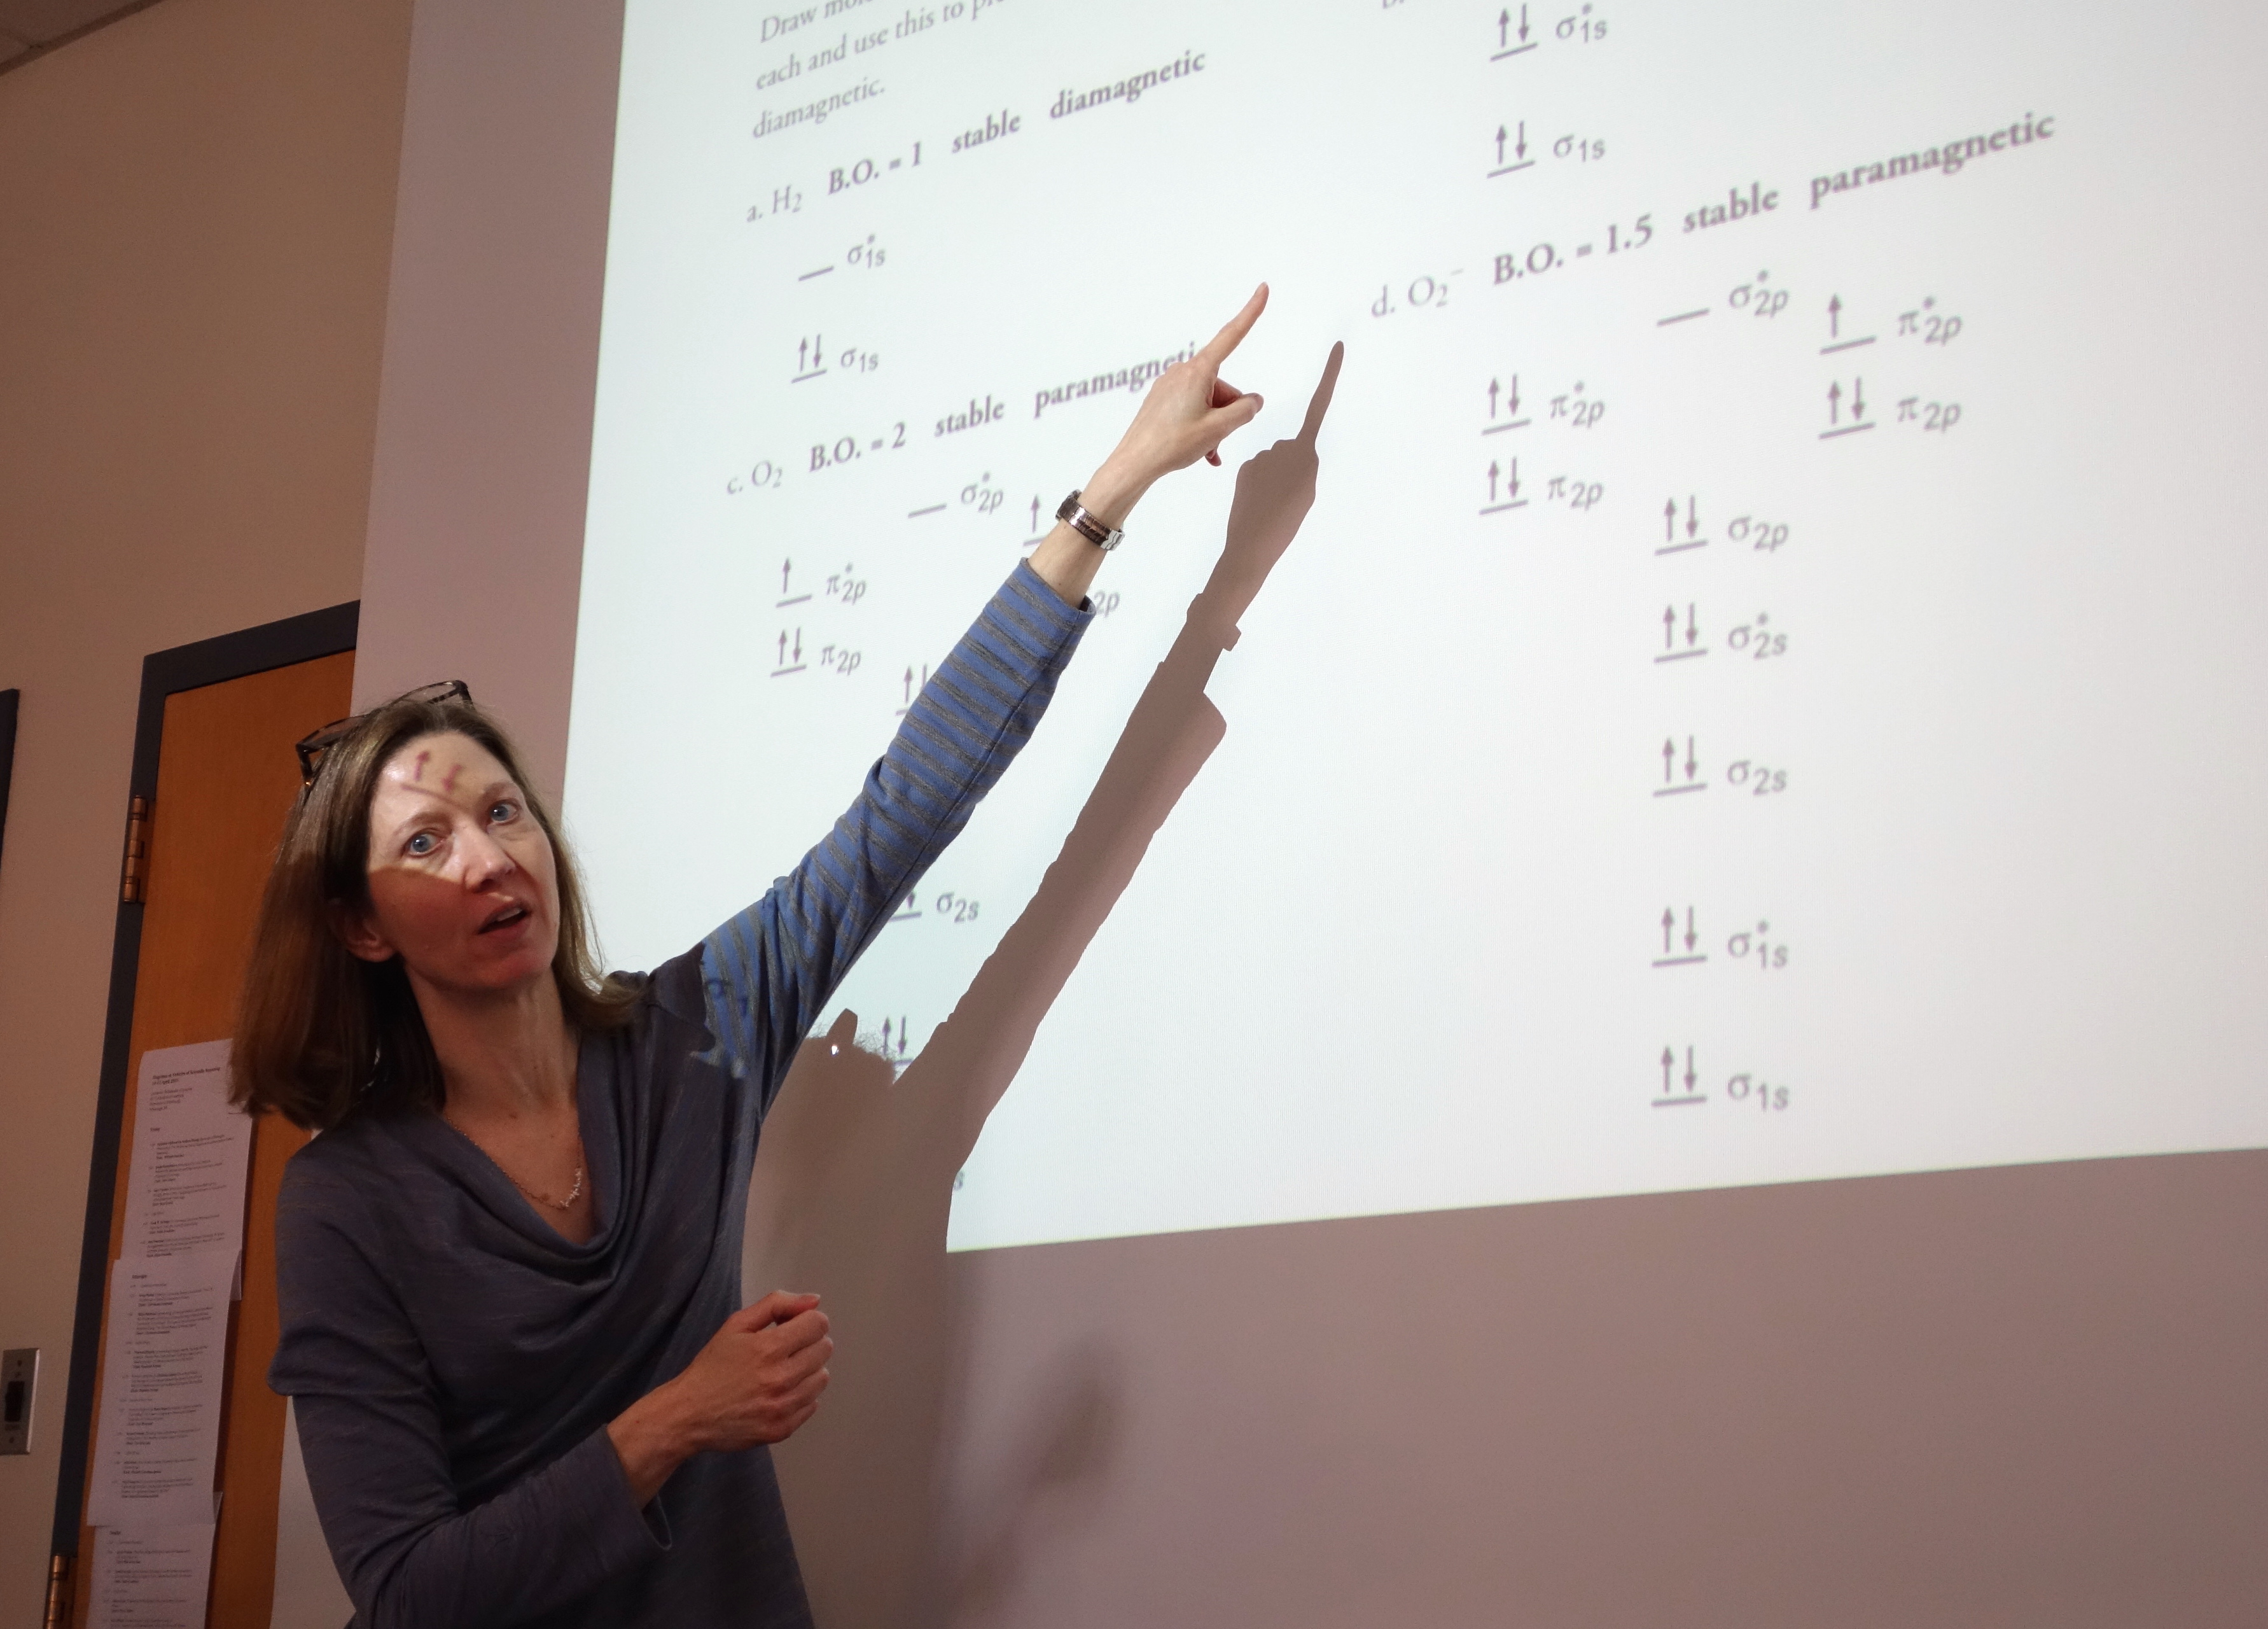
With these thoughts in back of my mind, I sat down to hear the first keynote speaker, Andrea Woody. Her title was promising:
“The Mediating Role of Diagrammatic Representation in Chemical Reasoning”
So I took at seat at the front of the room, from which I had a clear view.

I have long had a soft spot for chemistry. I loved it as a teenager and spent a few of my early years as a chemical engineer. So diagrams in chemistry are some of my oldest friends. Which would I now revisit?
 Andrea’s first example was the periodic table of the elements. It has an iconic status. It says “chemistry” to everyone who sees it. I even now vaguely recall an old science fiction story in which the table proved to be the Rosetta stone that let us decode the language of some alien civilization.
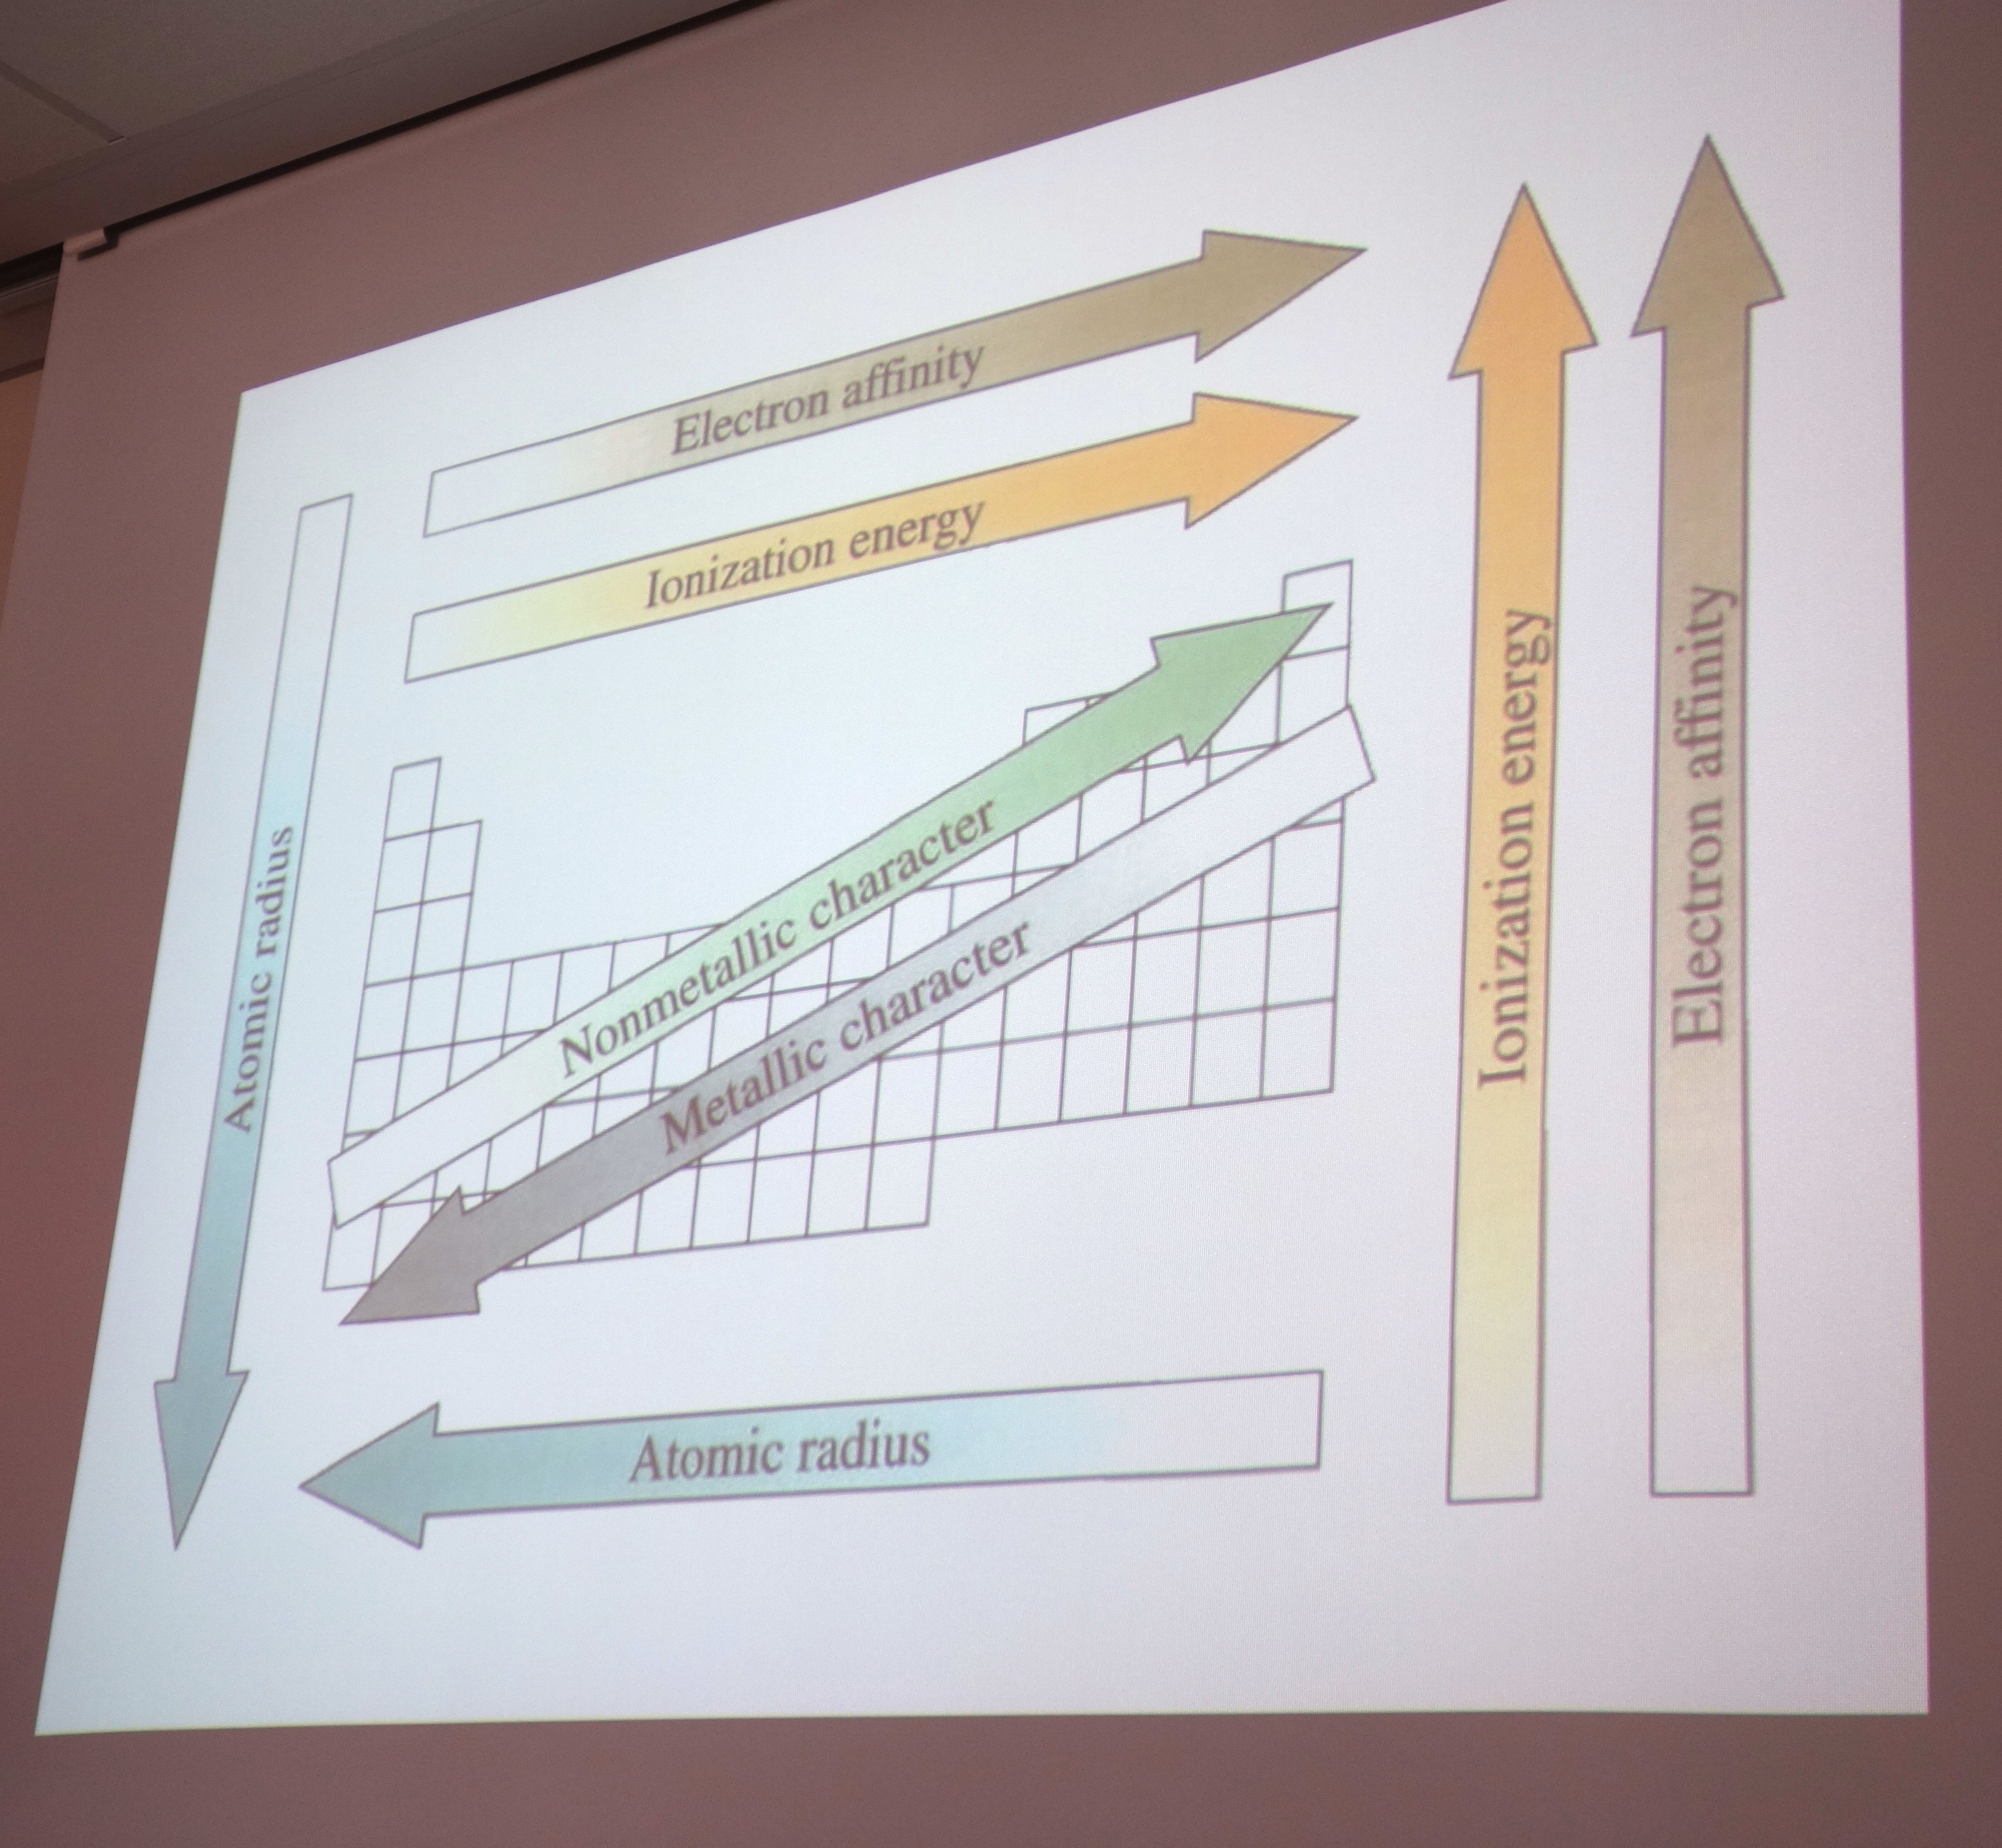
Andrea recalled for us just how the table works. There are many similarities of properties among elements. Those similarities can be captured quite effectively by a spatial representation in a table. Rows represent one thing; columns another. We have metals on one side and non-metals on another. There is a column for alkali metals, for alkaline earth metals, for halogens, and so on.
There has been a long history of efforts to capture all these relations diagrammatically in just the right way. Andrea carried us through them, in a rapid display of lovely images from the history of science. As they flashed past me, I tried to catch them with my camera.

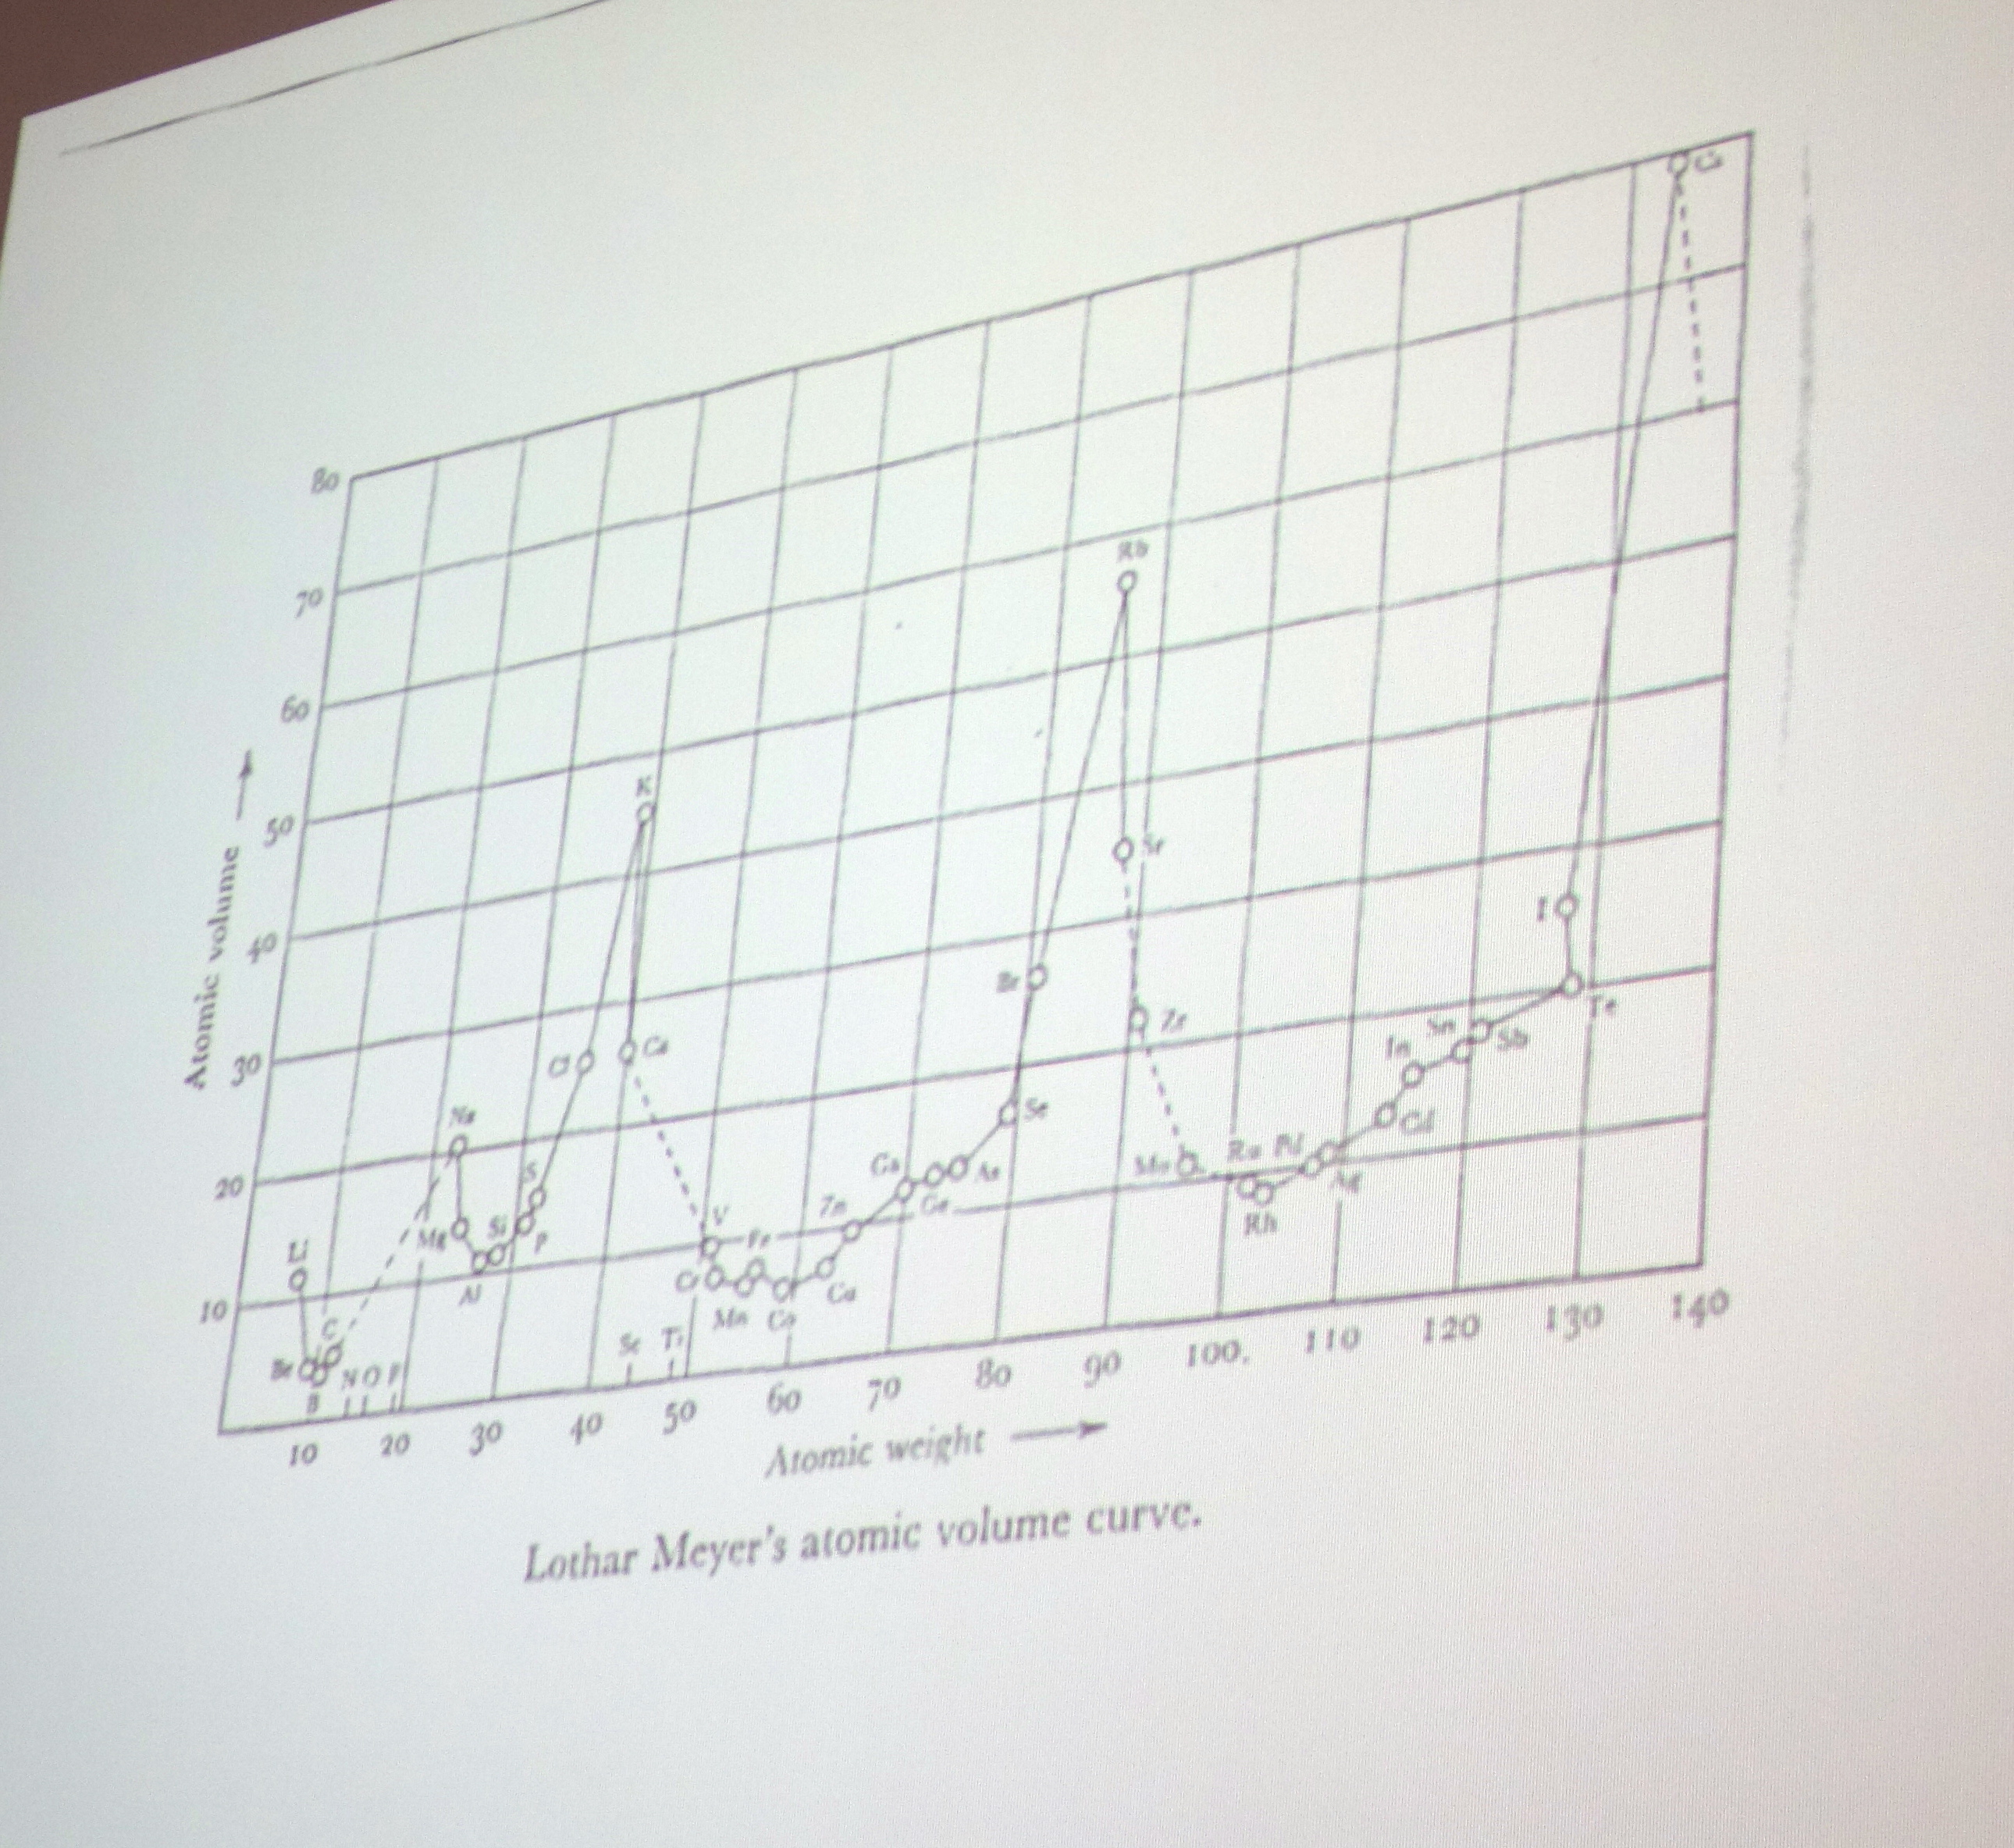
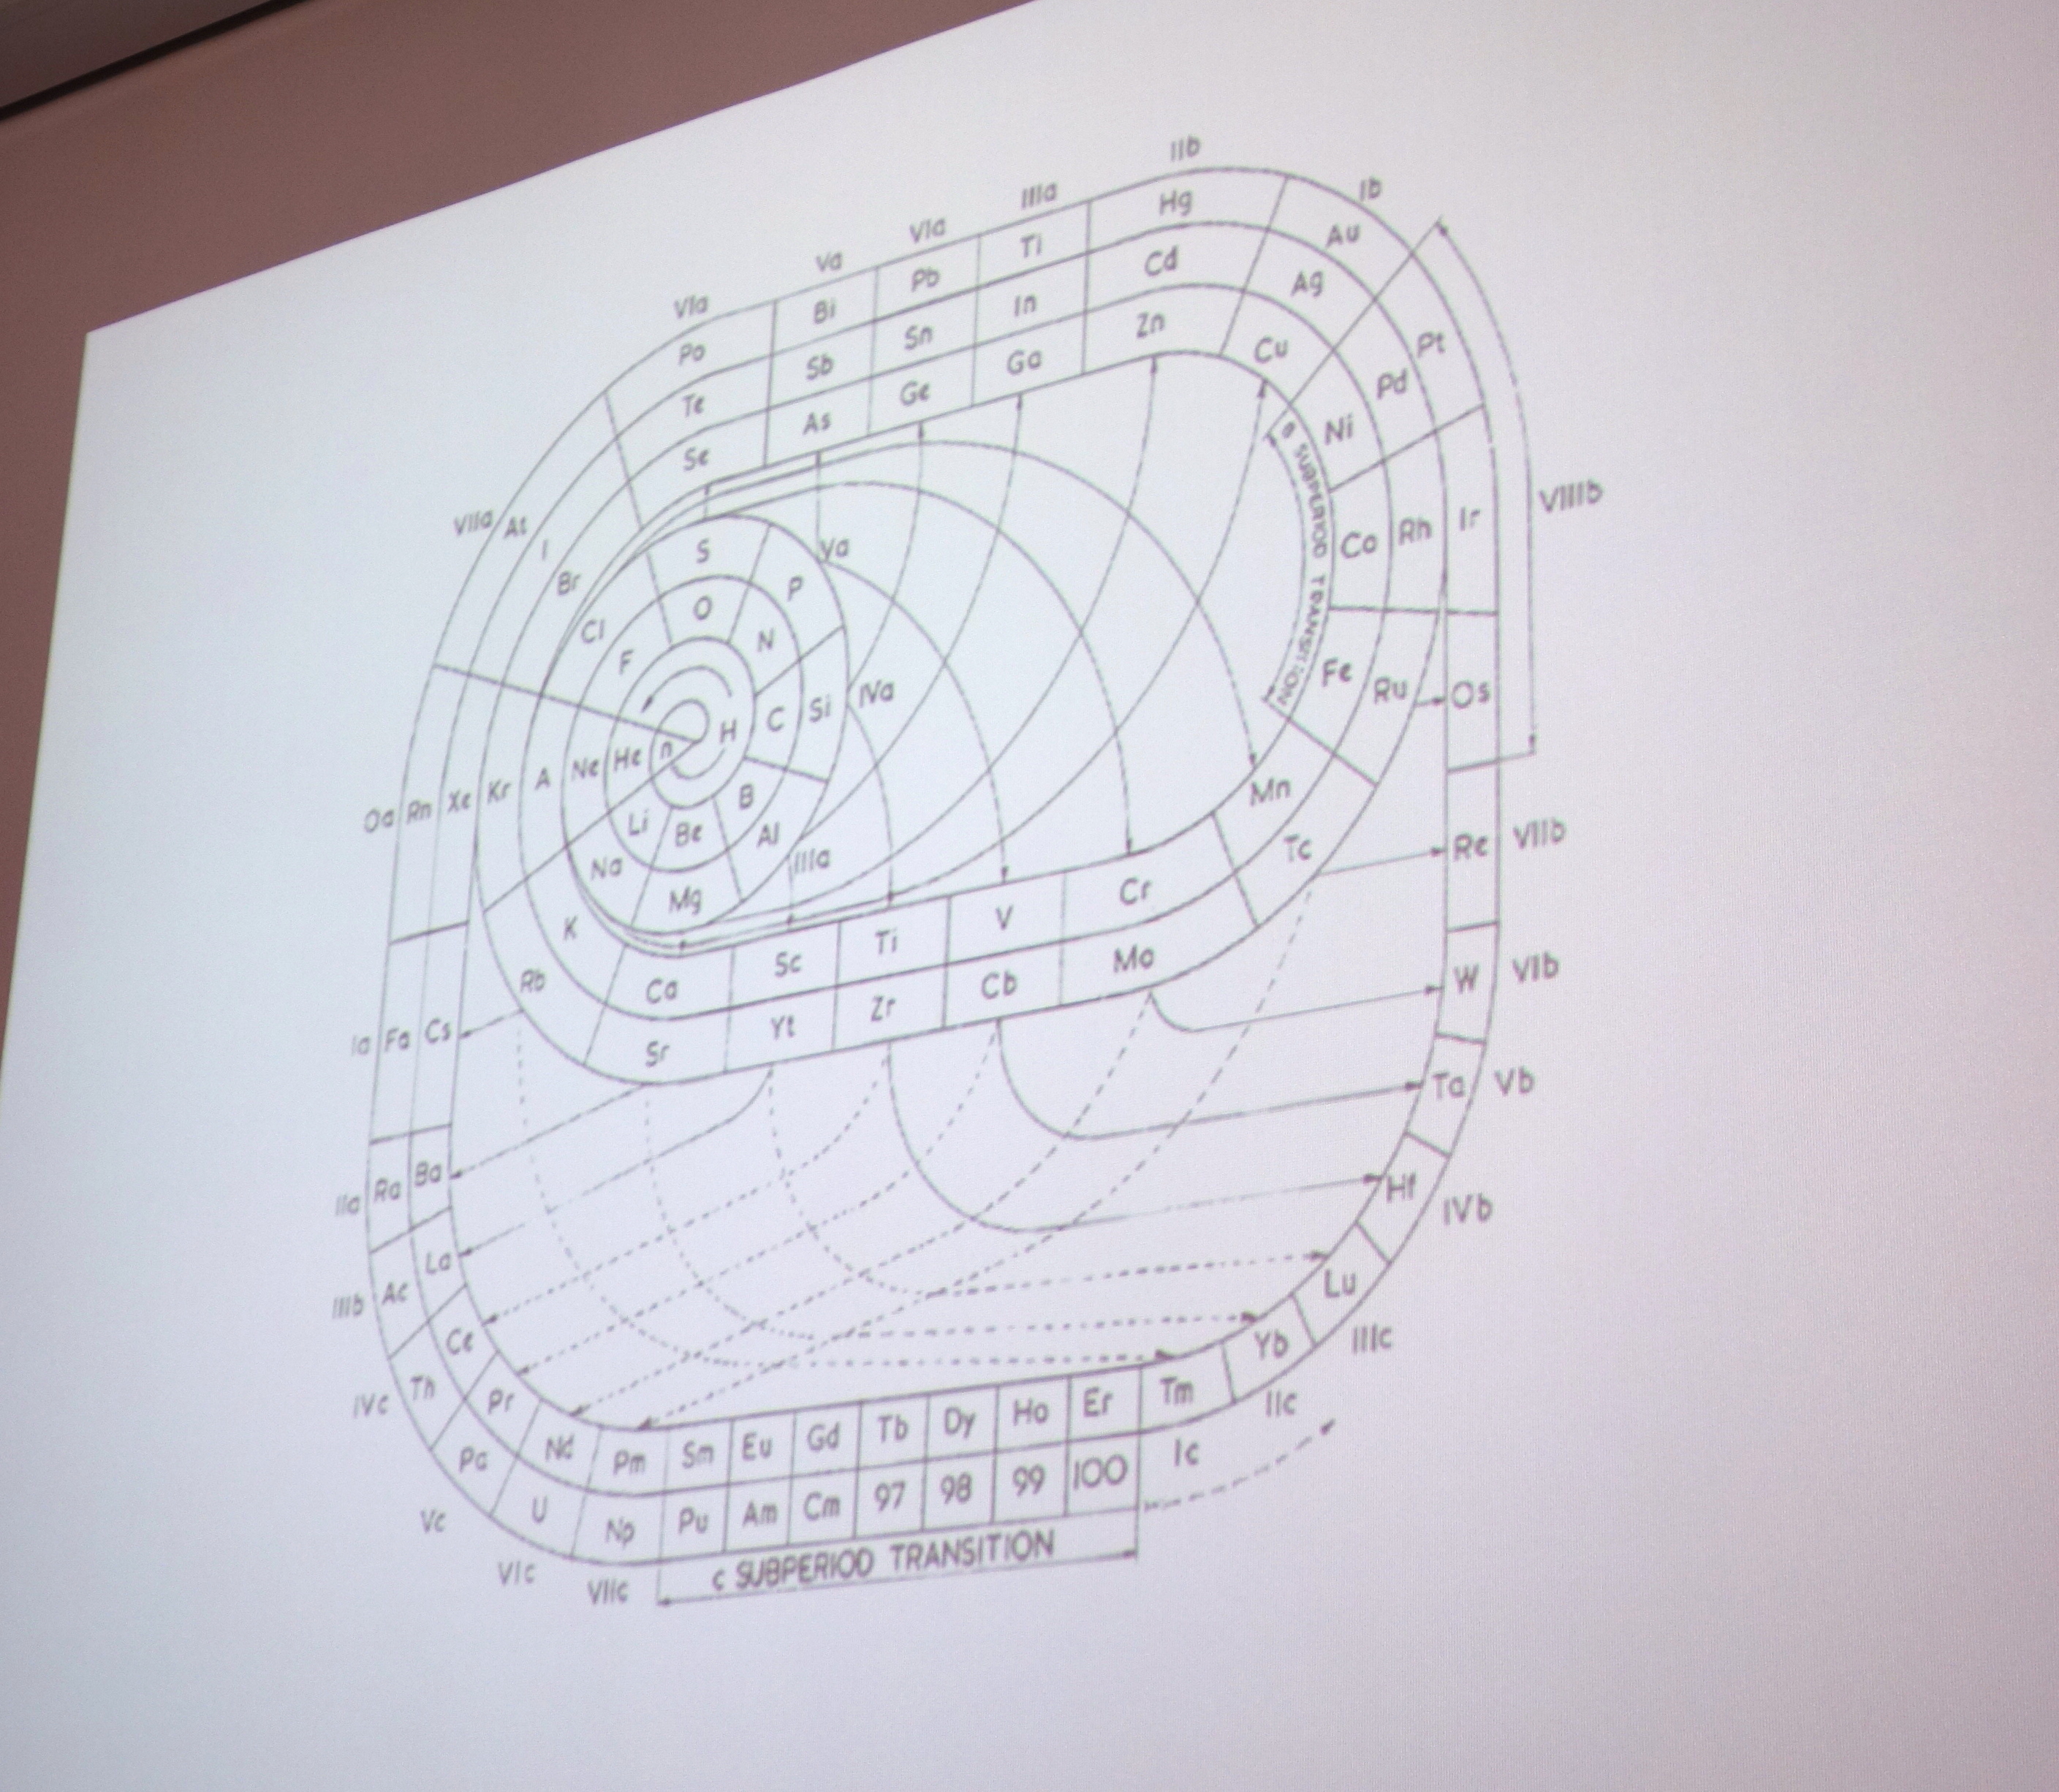

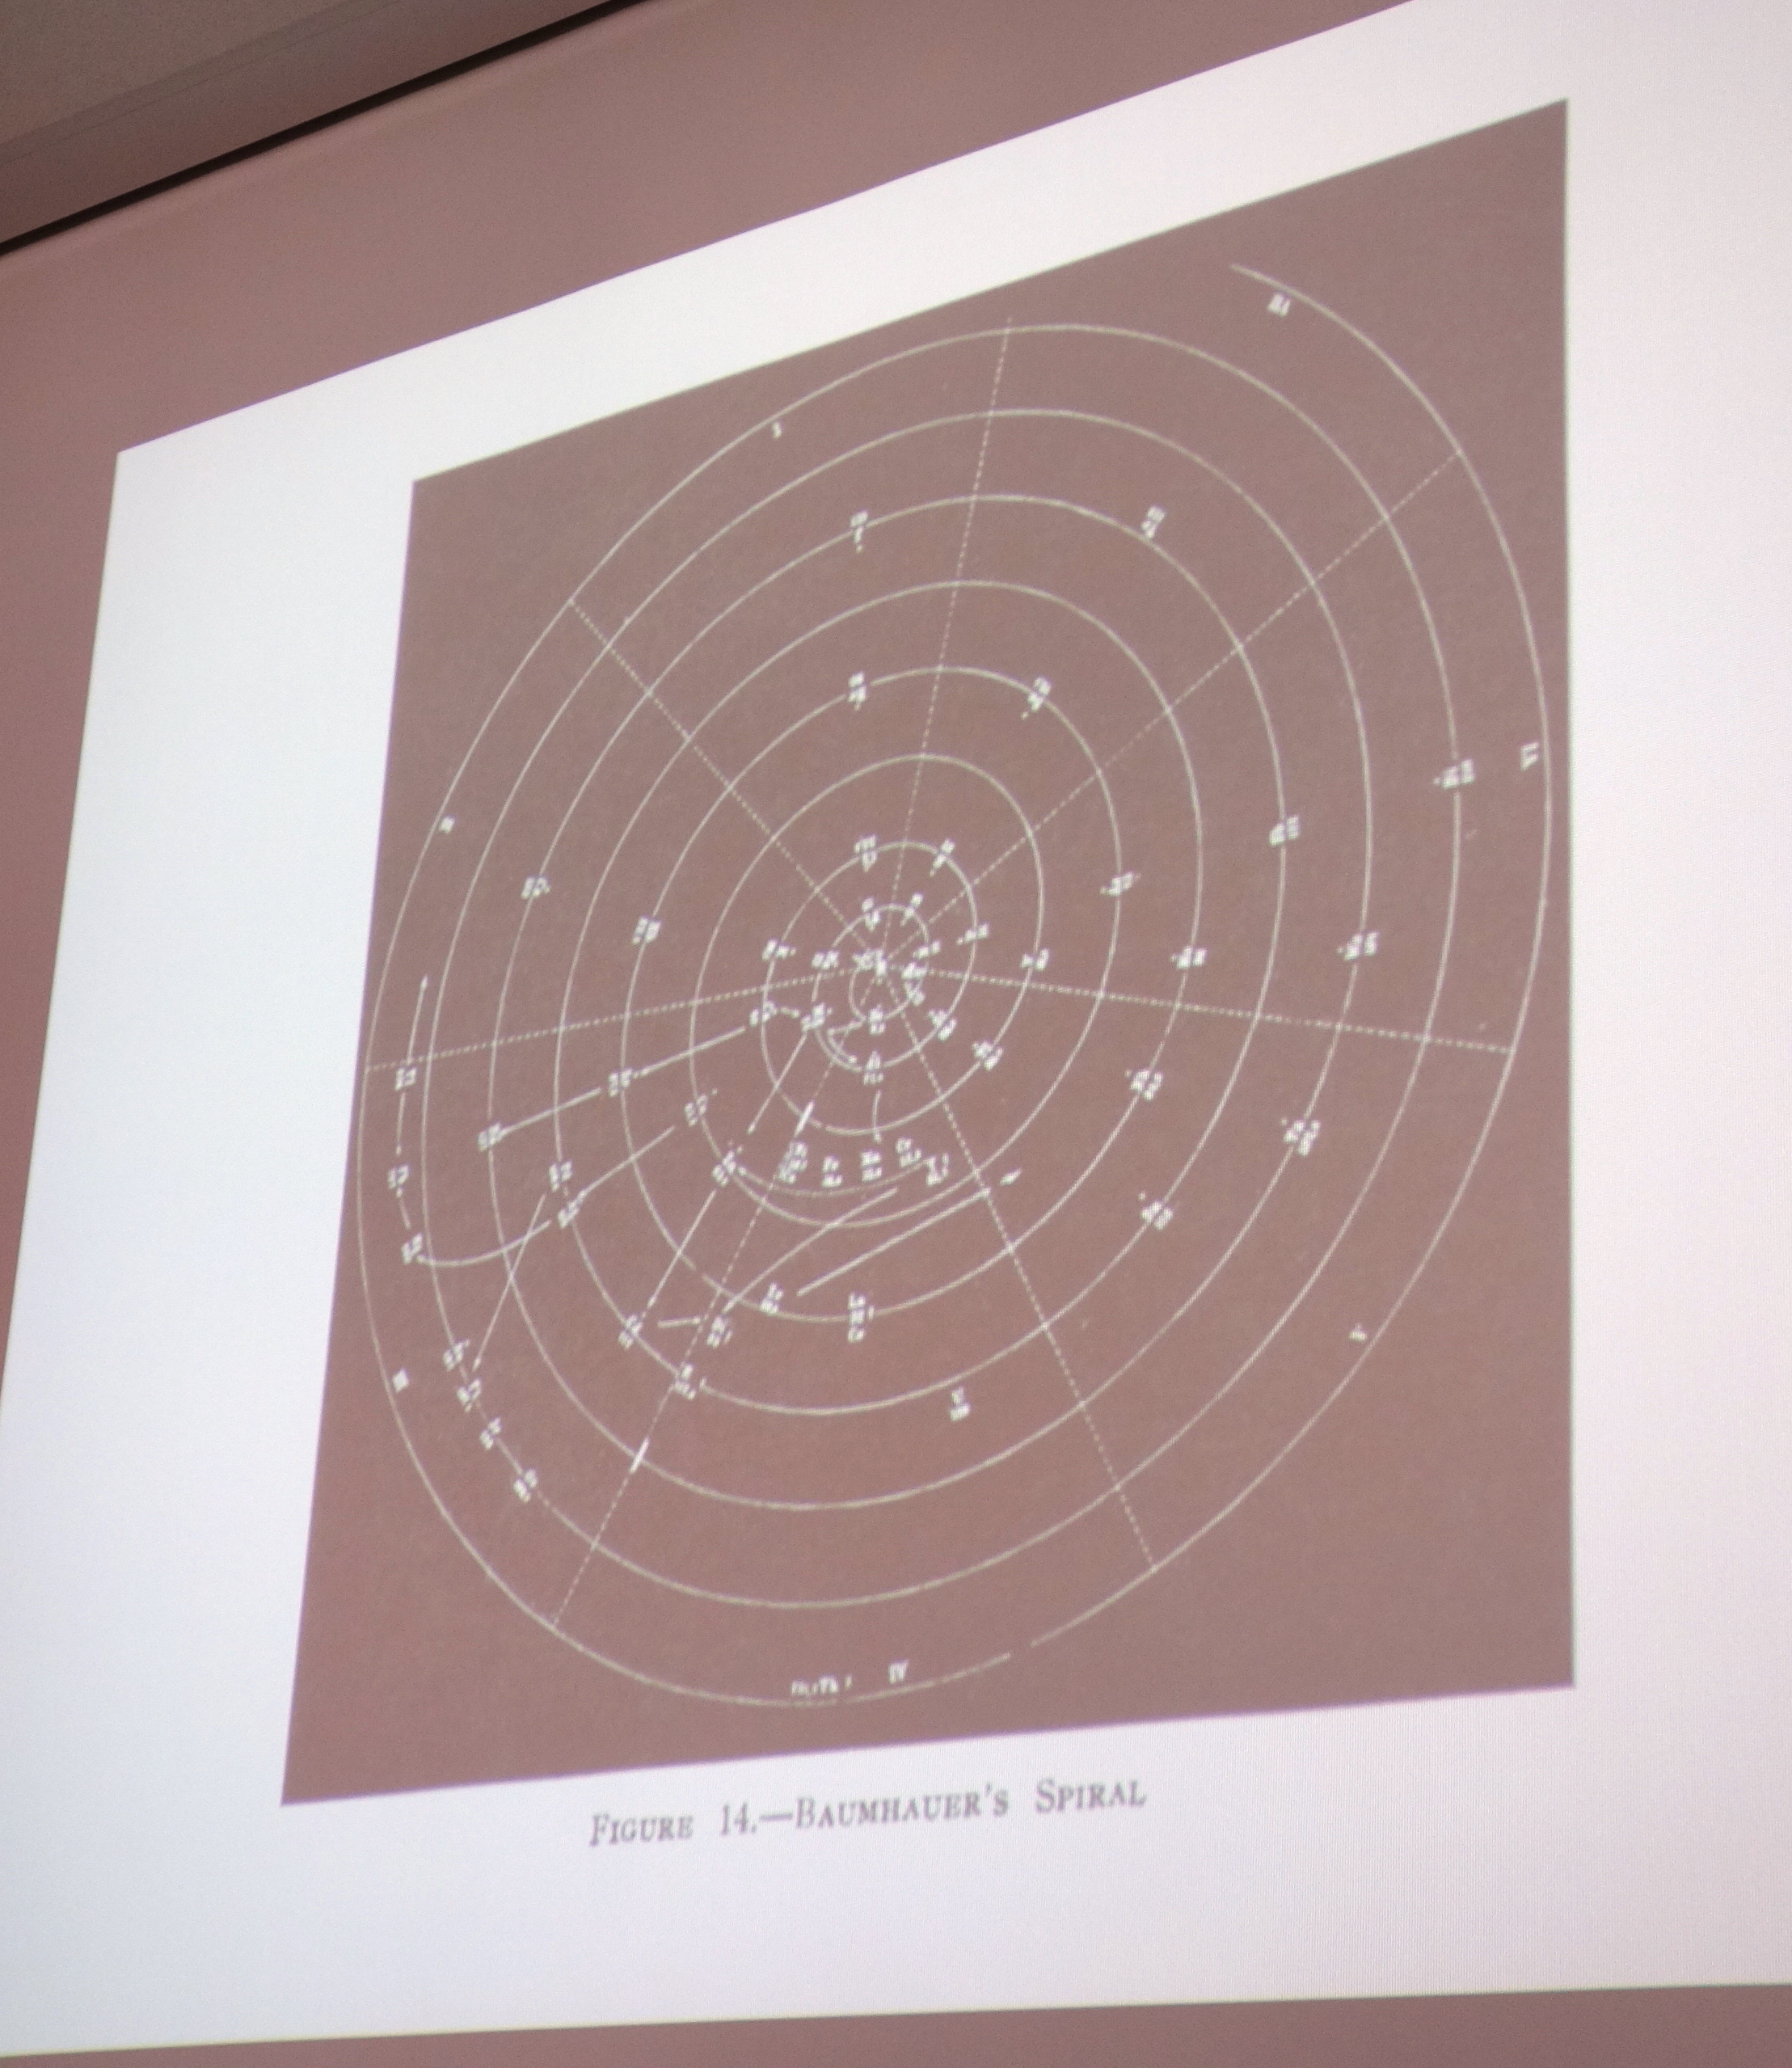

Spatial proximity reflects similarity of property-—this is the key fact in the diagram that supports inference. But is this really a case in which the diagram is the final arbiter? Or is it merely an aid and guide to facts that can be grasped quite well without the table, if only we ponder for a little longer?
Andrea’s next example brought me closer to my goal. They are the molecular orbital diagrams.
Then came just what I was looking for, “energy diagrams.” A full understanding of chemical bonding requires some elaborate quantum mechanics. An oxygen molecule, for example, has sixteen electrons spread in a massively complicated quantum cloud around two nuclei. Yet chemists need to be able to grasp the properties of the bond without needing to enter the high dimension configuration space of the Schroedinger equation for this system.
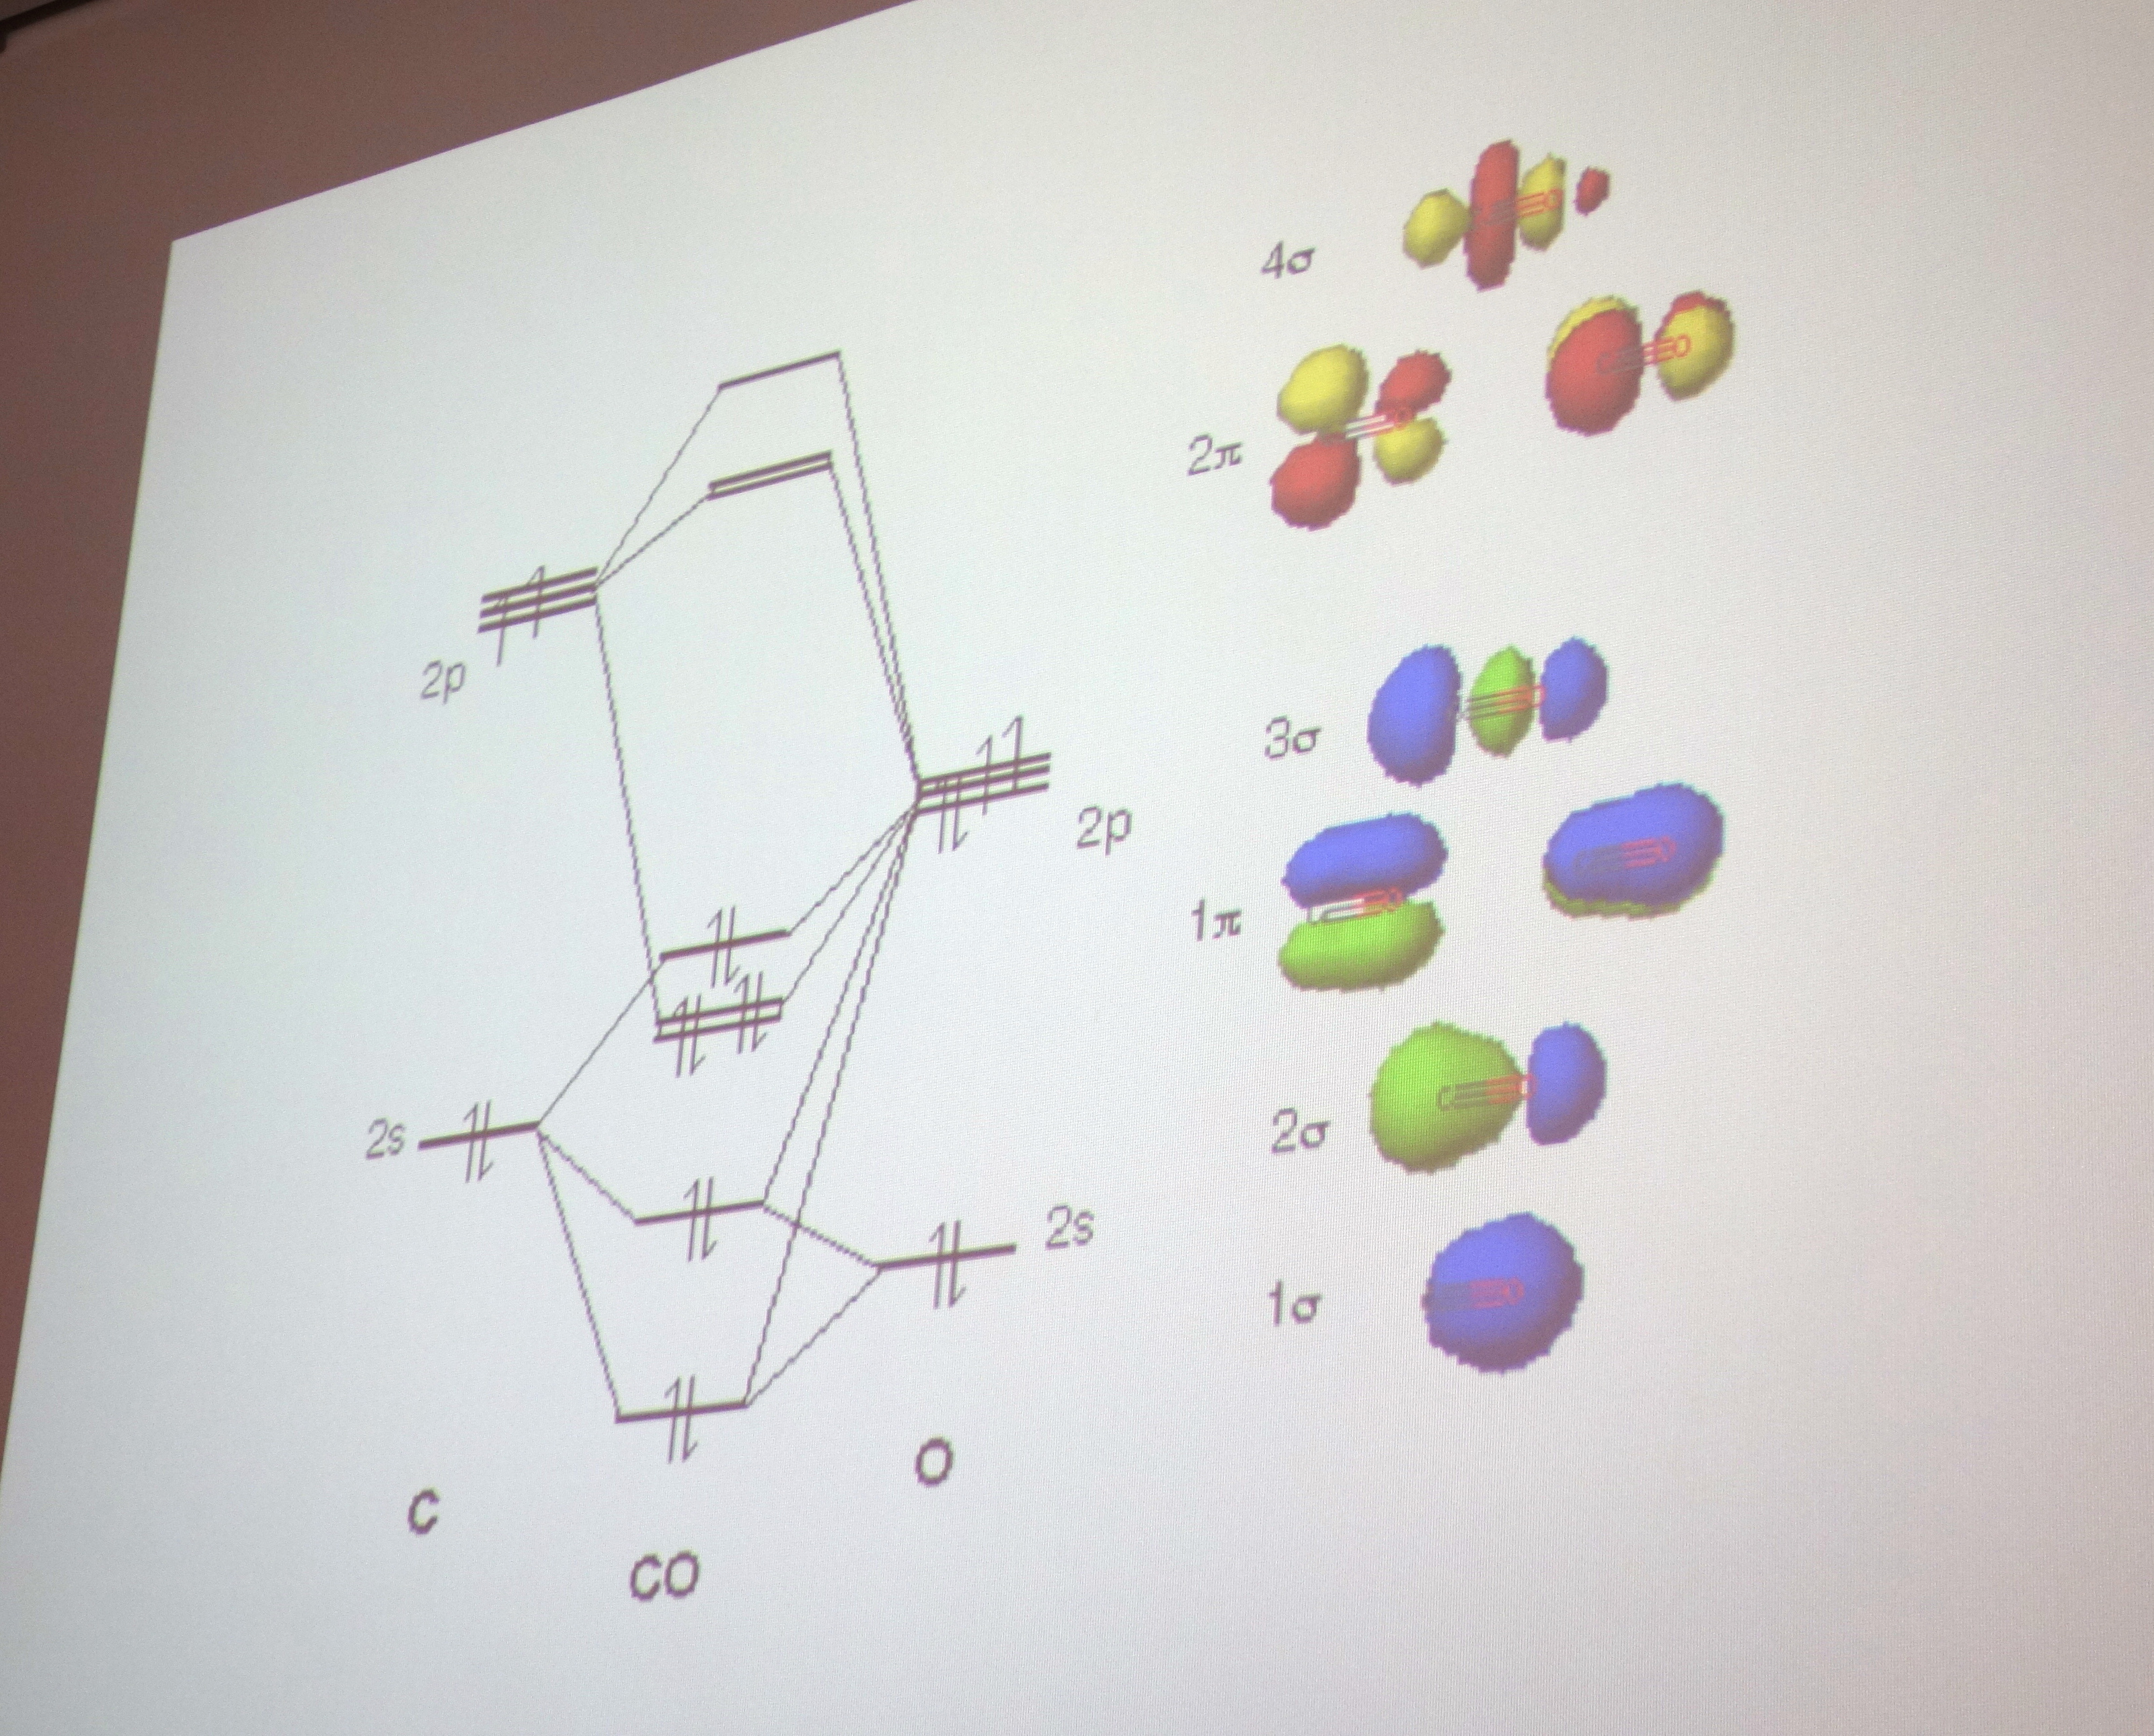
The way it is done is with a simple diagram. It has several columns, corresponding to various positions of the electrons, with blank slots into which electrons can be inserted. The higher the slot is up the page, the greater the energy. You use the diagram by filling the slots from the low energy bottom upwards. Do it that way and you populate the molecule with electrons in their lowest energy states, which corresponds to a stable bond.
The technique is so powerful that chemistry students learn it and use it before they have any real comprehension of the ocean of quantum complexity that lies behind a chemical bond.
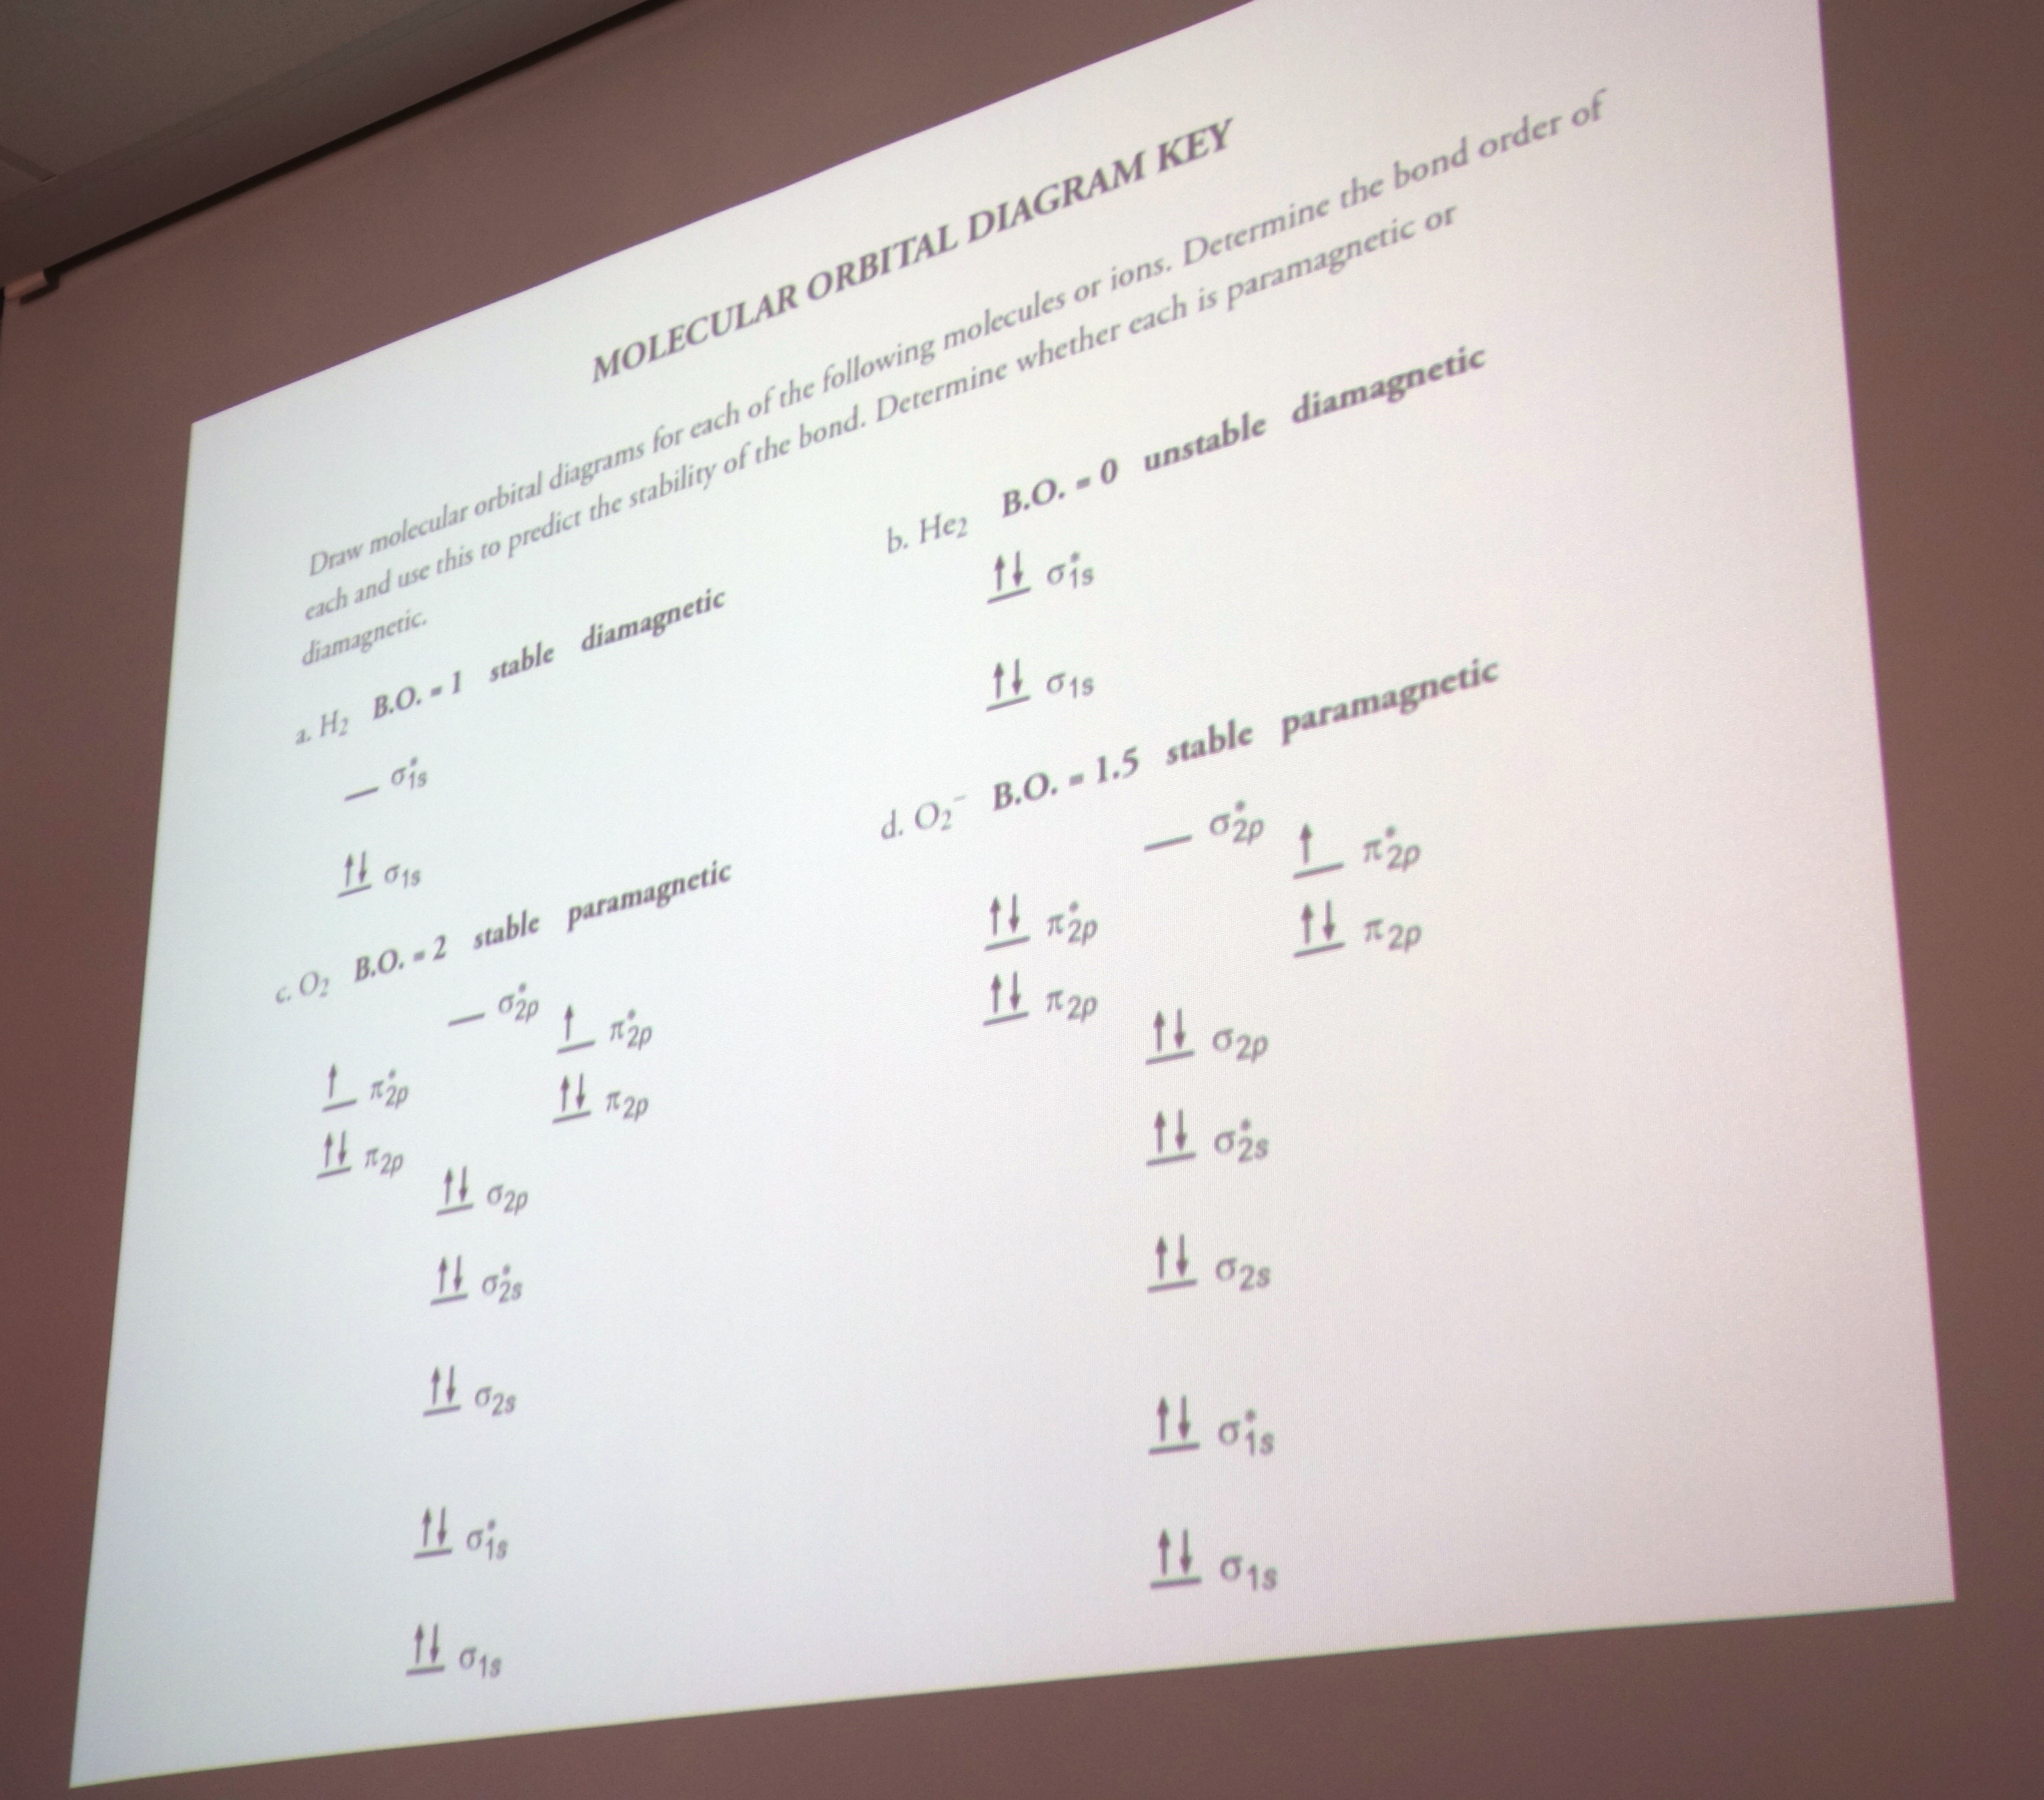
Andrea had a lovely example of the inferential power of this diagram. Electrons are inserted into it as little arrows that can point up or point down. The arrows correspond to the direction of each electron’s spin and, as a result, the magnetic moment. Since the electrons fill the slots in up-down pairs, their magnetic moments cancel and the magnetic properties are neutralized.
Now comes a puzzle. Molecular oxygen has sixteen electrons, which should mean all the electrons are paired and there is no residual magnetism. However that is not what we find in the laboratory. Oxygen is paramagnetic and is deflected by a magnetic field.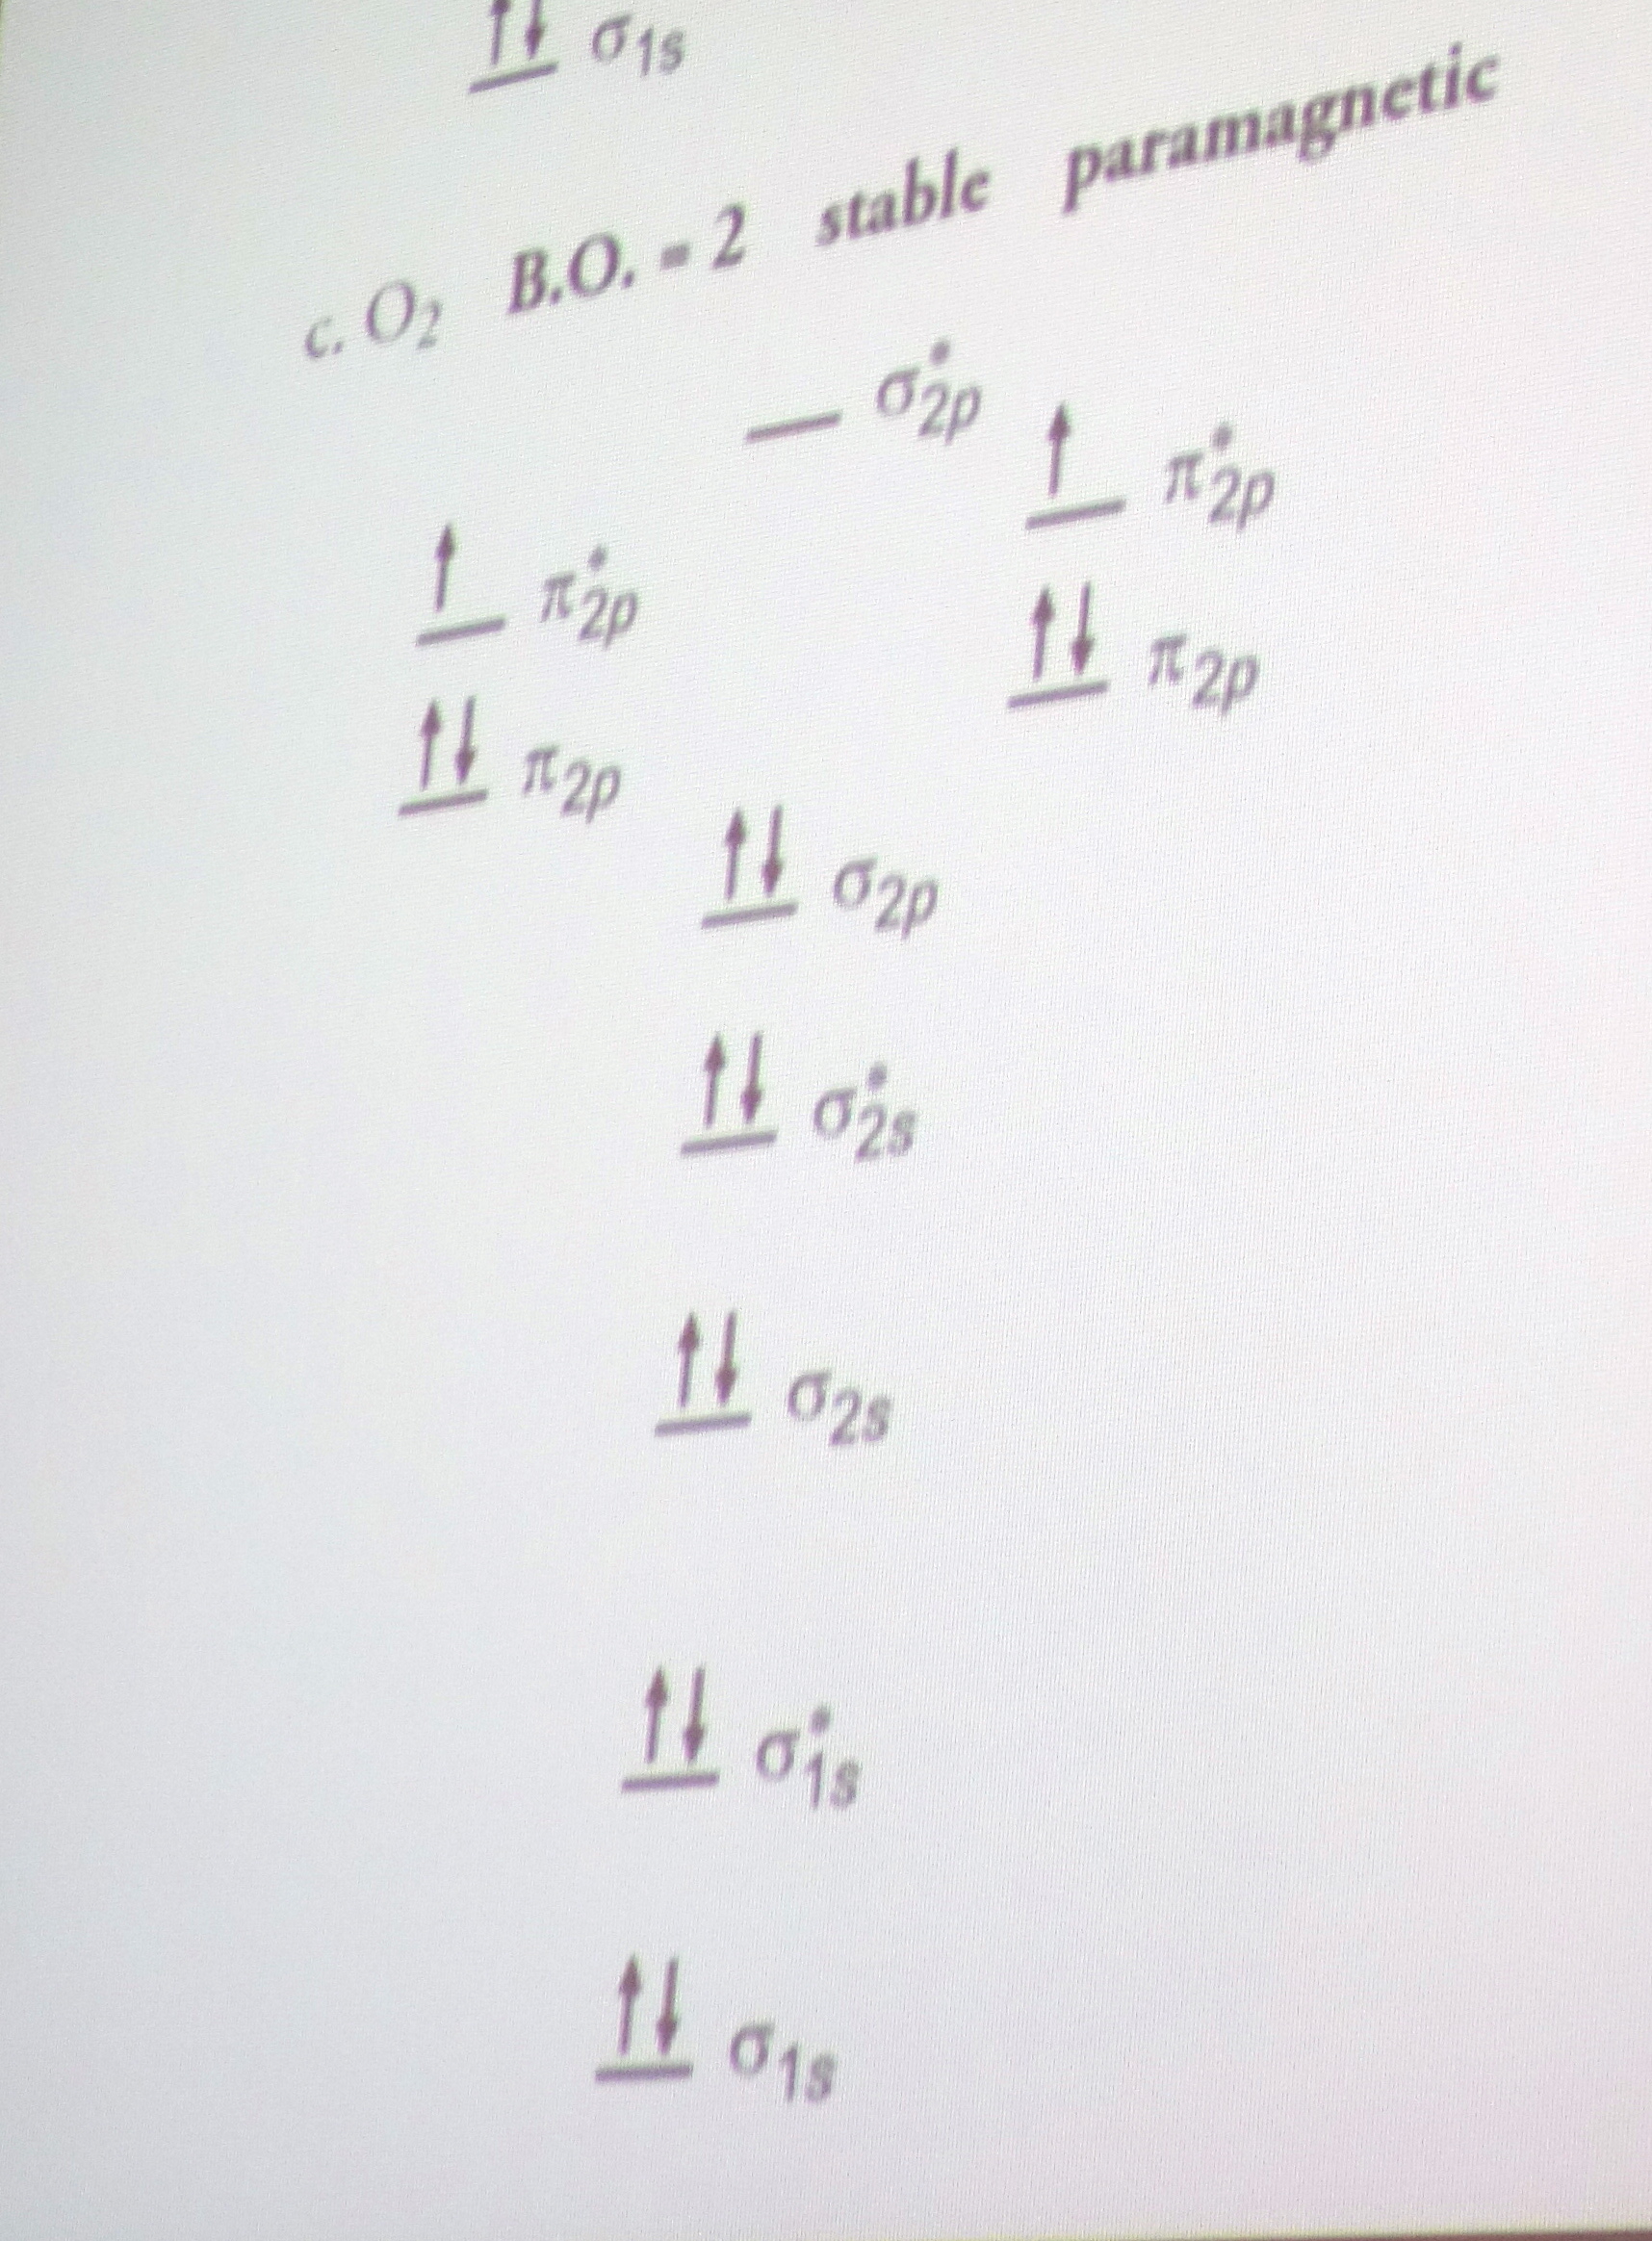
The energy diagram gives the answer. As you fill up the slots, you end up with two unpaired electrons in the highest populated energy levels.
Here is the solution to the puzzle! Two unpaired electrons means two unneutralized magnetic moments for molecular oxygen. It’s in the diagram and you see it immediately. Any student who has learned to work the diagrams could arrive at this solution.
This was a splendid example of primary reasoning in a diagram. As Andrea continued, I began to ponder the question of just what makes it reasoning. Is it an activity on a par with more traditional forms of reasoning? Or is it something less? If it is on a par, we should be able to map its components onto more traditional forms of reasoning.
Can we do this mapping? This was the question I asked Andrea in question time. Prudently, she deprecated the activity of taking old fashioned ideas as the right standard for measuring novel forms of reasoning now. This caution was exactly the right point. Why should I cede priority to what is done in some formalized logic, such as used by the logical positivists? Why should I take it as the ultimate standard for reasoning against which all other efforts are measured?
Nonetheless, Andrea continued by going to this very example of paramagnetic oxygen, even though I had not named it specifically. She had little trouble mapping its parts onto those of a standard inference. Here are premises, she began . . .
![]()
There is more, so much more, to report. The conference had an eclectic mix of speakers by design. There are many philosophers, but also psychologists, educators and scientists. Ask each what is important about diagrams and you will hear a wonderful answer. But each will take you in a different direction, so that there is no simple overview to recount.
One thought did rise and stick with me, as I heard the talks. There is real energy for philosophy of diagrams in science. But the analysis is still in a preliminary stage. It is almost fully engaged in reporting descriptively how diagrams are being used in science. (I did not manage to hear all the talks, so my apologies if I missed something.)

What is the next stage or stages? A mature “philosophy of . . .” is structured around polarities. There are two or more extreme positions, articulated at some length, with familiar arguments codified for each. Think of the realism-antirealism debate. Those two views are the polarities. The arguments are “no miracles” and the “pessimistic meta-induction.” The argumentative terrain is well-mapped and well-understood. I merely need to gesture at widely understood labels to call it to mind.
Is there a similar structure emerging here? While I listened to the talks, I cast about for a polarity. I settled on the obvious one.
How different is diagrammatic reasoning from more traditional forms of reasoning?
At one pole, we would say that all the diagrams do is to provide premises. The reasoning itself is no different from what a logical positivist would have recognized, while perhaps not reasoning in a formalized calculus. The older tradition took photos of stars near the rim of the sun at an eclipse to provide premises to be used by inferences pertaining to general relativity. Are we doing the same thing now, but perhaps just with fancier diagrams?
Or, at the other pole, we portray diagrammatic reasoning as something qualitatively different. Do we arrive at well-justified conclusions by a means distinct from those traditionally employed? And, if so, what are those means and how do they work?
Laura Perini gave a wonderful talk on what she called “evidential reasoning” in the context of the diagrams produced in protein analysis by electrophoresis. Since she had repeatedly pointed to the diagrams as evidence, I could ask her about just these polarities.
She thought for a moment and produced what is surely an important observation: the first polarity neglects just how diagrammatic representations are reduced to propositions for traditional argumentation. “Good point!” I thought. I wanted to press on and ask more about that process. But there were too many questions in the queue. My time was up.
The episode was not over, however. In the break after the talk, I was immediately assailed by a few conference participants, eager to sort out my misconceptions. It was an odd experience, since I had advocated nothing. I was merely seeking to map what I hoped might be an already-existing argumentative terrain.
This, once again, is a symptom of an immature field. A query after that structure is mistaken for an assault on the cogency of the field as whole. I persisted, reopening discussion in the next break.
Might we think of perception as a form of reasoning? Then diagrammatic reasoning might be understood as an extension of perception. That didn’t seem to me like such a crazy idea. But it was resisted and, even now, I cannot reconstruct just why it was resisted. In a mature field, in response to this sort of query, you are told wearily and mechanically, “well, there’s X’s argument for this and Y’s reply and . . . “
There is work to be done.
John D. Norton