| front |1 |2 |3 |4 |5 |6 |7 |8 |9 |10 |11 |12 |13 |14 |15 |16 |17 |18 |19 |20 |21 |22 |23 |24 |25 |26 |27 |28 |29 |30 |31 |32 |review |
 |
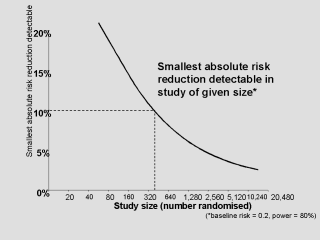
- This graph shows the smallest absolute risk
reduction detectable in trials of a given size - On the horizontal axis is the study size (that is, the number of patients randomised in the trial) - And on the vertical axis is the absolute risk reduction that would be detectable - So, for example, suppose after head injury 20% of patients were dead. For a study to detect a 10% absolute risk reduction, that is from 20% dead to 10% dead, we would need a study with about 400 patients |