| front |1 |2 |3 |4 |5 |6 |7 |8 |9 |10 |11 |12 |13 |14 |15 |16 |17 |18 |19 |20 |21 |22 |23 |24 |25 |26 |27 |28 |29 |30 |31 |32 |33 |34 |35 |36 |37 |review |
 |
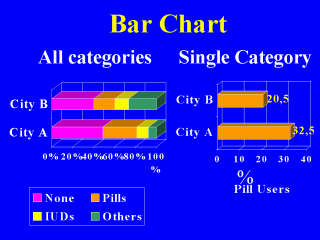
The bar chart is exactly the column chart but the bars are horizontal rather than vertical. Still they are constructed to show the frequency or relative frequency (percentage) for each category. Usually the bars are equal in width. It is important that the horizontal scale starts at zero otherwise the lengths of the bars are not proportional to the frequencies. |