| front |1 |2 |3 |4 |5 |6 |7 |8 |9 |10 |11 |12 |13 |14 |15 |16 |17 |18 |19 |20 |21 |22 |23 |24 |25 |26 |27 |28 |29 |30 |31 |32 |33 |34 |35 |36 |37 |review |
 |
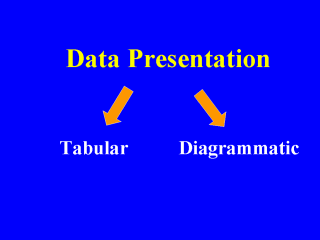
Data needs to be presented in an appropriate and interpretable way. Data is presented in a tabular (table) or diagrammatic form (graph or chart). Tabular presentation allows for organization of the results into a compact and readily comprehensible form. Diagrammatic presentation gives a better appreciation of the characteristics than tabular presentation. |