 |
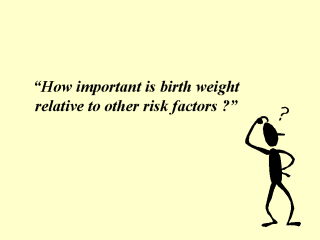
One method for examining the public health importance of an
exposure is the population attributable fraction (PAF). The PAF provides an estimate of
the proportion of cases of a disease resulting from a given exposure. In a review of
papers on type 2 diabetes, a number of studies did not report the required information for
the calculation of PAFs. Among studies with available data, PAFs were calculated and
determined to be negligible to moderate, ranging from 0.01 to 0.25 for the lowest birth
weight category (cut-off points varied by study). In contrast, being overweight as an
adult was associated with PAF of 0.66 for women and 0.56 for men (Boyko EJ. Diabetes Care
2000; 23:1260-1264). The greater relative risk associated with having two risk factors,
low birth weight and a high adult weight, would not result in a higher PAF given that a
smaller proportion of the population would be exposed to both factors. The comparison
of PAFs associated with a variety of exposures is helpful in characterizing the relative
importance of different risk factors in the burden of disease in a given population. It
should be noted, however, that PAFs can vary greatly between study populations depending
upon the incidence of the exposure. Thus, while intrauterine growth retardation likely
plays a less important role than adult obesity, it may have a substantial effect on the
development of diabetes in a given population. |