 |
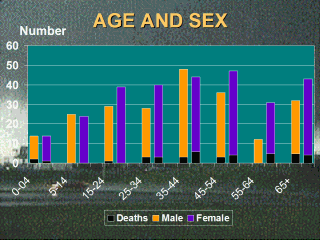
- This graph shows the age and gender distribution of
individuals who were injured or killed directly in the tornado.
- The black portions of the bars indicates the deaths.
- The average age of injured survivors was 38 years, the
ages of injured survivors ranged from 1 month to 98 years of age.
- Persons who died were generally older as demonstrated
by the skewed distribution of the black bars in the graph. The average age
was 47 years ranging from 3 weeks to 94 years and that was significantly
higher than the average age of survivors.
- Proportionally, more females than males were injured or
killed. 58% of persons who died were female, and 55% of injured survivors
were female.
- Race is not shown on this graph, however, we were able
to obtain race information for 64% of injured survivors. Of these, whites
had the highest rate of injury (10.8 per 100,000), followed by African
Americans (6.9), and Native Americans (1.5).
- The death rate among whites was over 1 and ½ times
higher than the death rate among Native Americans (1.3 and 0.8 per
100,000, respectively). There were no African Americans who died in the
tornado
|
