| front |1 |2 |3 |4 |5 |6 |7 |8 |9 |10 |11 |12 |13 |14 |15 |16 |17 |18 |19 |20 |review |

|
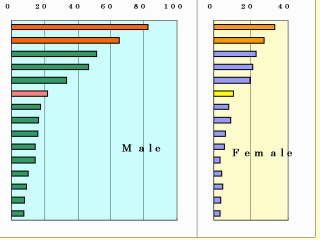
Annual rate per
100,000 standardized to world population in selected registries. Source: Cancer Incidence
in Five Continents Vol 7, International Agency for Research on Cancer (IARC), 1997. 10-fold difference between US whites and Japan. High-risk areas: Japan, China, and Central & South America. Low-risk areas: North America, Australia & western Europe. SeeGLOBOCAN |