 |
Now we
will talk about how to analyze the hazard period data and control data to
estimate the effect of exposure on the outcome. Since there are 2 types of
control data, we will also have 2 types of analyses.
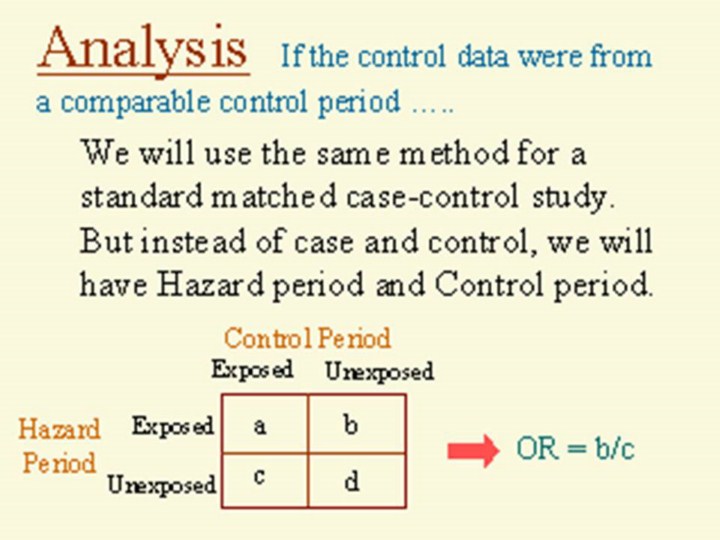
If the control data are from a comparable control period, the analysis will
be the same as that for a matched case-control study. However, instead of
concordant and discordant pairs of study subjects in a matched case-control
study, here we will have concordant and discordant pairs of exposures from
the hazard period and control period. That is, the pairs are made up of two
intervals(hazard period and control period) for each subject, and the pairs
are either concordant or discordant for exposure. After arranging the data
in a 2 by 2 table as shown in the slide, we can just use the standard method
for matched case-control to get the odds ratio.
|