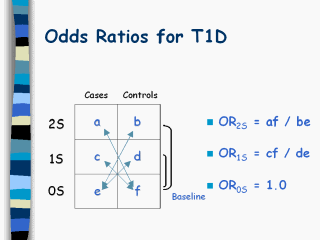
Boxes a and b reflect the
number of cases and controls, respectively, who have 2
susceptibility haplotypes.
Boxes c and d represent the number of cases and controls,
respectively, with 1 susceptibility haplotype.
Boxes e and f represent cases and controls, respectively,
with 0 susceptibility haplotypes.
Since these groups are at lowest genetic risk – they serve as
the baseline, which will first be compared to the 1S groups to
calculate the OR associated with the presence of 1 susceptibility
haplotype. Then the 2S groups
are compared to the baseline to calculate the OR associated with 2
susceptibility haplotypes.
The formulas for the OR calculations are shown above.
