| front |1 |2 |3 |4 |5 |6 |7 |8 |9 |10 |11 |12 |13 |14 |15 |16 |17 |18 |19 |20 |review |
 |
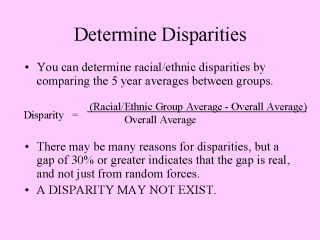
There are statistical tests to
determine if there are actually disparities in health outcomes by race, etc. These are
require an advanced understanding of mathematics. You can find statistical guidance at: http://www.health.state.pa.us/stats/techassist/flow1a.htm . There are no "rules of thumb" for determining if a disparity is significant. The Urban League of Pittsburgh (see below) created one. They chose the figure of 30% difference, because this is an amount that is greater than would be expected by random chance. The following conditions were used to identify a disparity: 1. The racial/ethnic group rate exceeds 30% of the Healthy People 2010 goal. 2. The racial/ethnic group rate exceeds the total rate by 30% or more. 3. The local rate for the ethnic.racial group exceeds the state or federal rate by 30%. 4. Ethnic/racial group rates are increasing over the study period. The author considers the argument above as a totally reasonable guideline. Usually, the numbers speak for themselves in dealing with racial and ethnic disparities. It is important that the numbers be allowed to speak. Disparities will be a thing of the past when statisticians have to make academic agreements over the significance of differences. The Urban League of Pittsburgh issued three “Black Papers” highlighting racial disparities in the health status of African Americans. - “The Health Status of African Americans in Allegheny County”, “Sexually Transmitted Diseases Among African Americans in Allegheny County”, and Health Problems Among African American Women Age 35-64 In Allegheny County”, all September, 2001.These can be found at http://www.ucsur.pitt.edu/Black%20Papers/blackpaper.htm |
| front |1 |2 |3 |4 |5 |6 |7 |8 |9 |10 |11 |12 |13 |14 |15 |16 |17 |18 |19 |20 |review |