| front |1 |2 |3 |4 |5 |6 |7 |8 |9 |10 |11 |12 |13 |14 |15 |16 |17 |18 |19 |20 |review |
 |
The US Centers
for Disease Control and Prevention has proposed in Healthy People 2010 the goal of
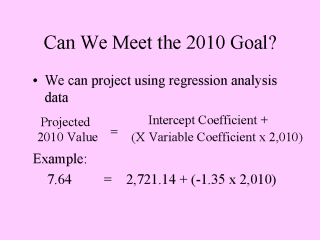
eliminating all racial/ethnic disparities by 2010. If you have 5 data points on a graph, you can get a ruler and try to draw a straight line that fits them all. Regression Analysis uses math to create do this. It creates the best straight line which fits the data. Regression Analysis is often used for creating models, which then can be used to predict the future. Our simplified analysis is not a very good model. The events which effected health in the past 5 years may not continue into the future. However, you can use Regression Analysis to make a prediction, as long as you donít take it too seriously without further study. The regression analysis can be used to create the mathematical formula on the slide. The Intercept Coefficient and X Variable Coefficient are copied directly from the Regression Analysis results. 2010 represents a year, such as 2010, and the numerical value of that year, 2,010. In our example, 7.64 people per 100,000 are expected to die from colorectal cancer. 7.64 = 2,721.14 + (-1.35 x 2,010) 7.64 = 2,721.14 - 2,713.50 Predictions based on a linear projection of data may not be valid, but the should give something to think about. They re a starting point, not an end point. |
| front |1 |2 |3 |4 |5 |6 |7 |8 |9 |10 |11 |12 |13 |14 |15 |16 |17 |18 |19 |20 |review |