| front |1 |2 |3 |4 |5 |6 |7 |8 |9 |10 |11 |12 |13 |14 |15 |16 |17 |18 |19 |20 |21 |22 |23 |24 |25 |26 |27 |28 |29 |30 |review |
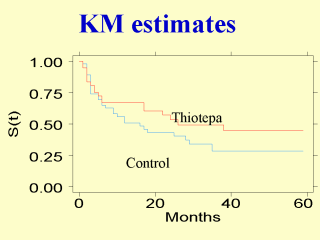 |
The Stata command sts graph, by(group) produces the above Kaplan-Meier estimates. (The figure has been edited for appearance.) The Thiotepa group had longer time to recurrence. The median survival time can be read from the figure, where S(t) = 0.5. The medians for the control and thiotepa groups are 16 and 26 months, respectively. The survival curves are roughly parallel, suggesting that an assumption of proportional hazard is acceptable. |