 |
The Kaplan-Meier method produces survival
curves. To test the null hypothesis that two survival curves are identical, e.g. in a
clinical trial with a control group (group A) and a treatment group (group B), the log
rank test is commonly used. In the slide we use the subscript i to indicate "at time
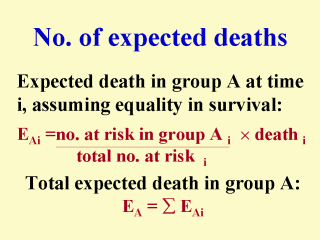
i", when a death is observed. The number of expected deaths in group A at time i (EAi)
is equal to the number of at risk subjects in group A at time i divided by the total
(groups A & B) number of at risk subjects at time i, multiplied by the total number of
deaths at time i. EBi is calculated in the same way. Total expected deaths in
group A and B (EA & EB) are then calculated by summing up the
expected numbers at different times (i.e., sum EAi & sum EBi). |
