| front |1 |2 |3 |4 |5 |6 |7 |8 |9 |10 |11 |12 |13 |14 |15 |16 |17 |18 |19 |20 |21 |22 |23 |24 |25 |26 |27 |28 |review |
 |
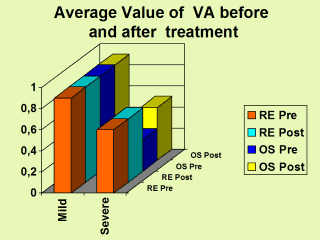
According to graph # 9, there isnít change in the average value of visual acuity, (VA) before and after treatment in the mild cases. However in severe ones, you can note the improvement of VA in the RE, that was significant in OS. The slight cases arenít tabulated as having a normal VA. |