| front |1 |2 |3 |4 |5 |6 |7 |8 |9 |10 |11 |12 |13 |14 |15 |16 |17 |18 |19 |20 |21 |22 |23 |24 |25 |26 |27 |28 |review |
 |
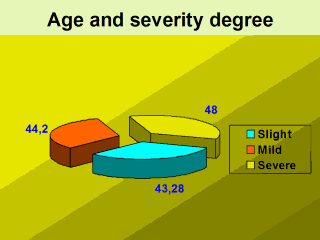
In graph # 2,
you can note that severe cases begin with an average of age higher than the
mild and slight ones. These conclusions are similar to those pointed out by
most of the consulted authors.
Following are outlined some of the cases that are examples of the above.
|