| front |1 |2 |3 |4 |5 |6 |7 |8 |9 |10 |11 |12 |13 |14 |15 |16 |17 |18 |19 |20 |21 |22 |23 |24 |25 |26 |27 |28 |review |
 |
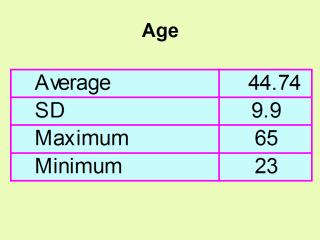
In Chart # 1,
you can see average values of the TO onset age in study cases.
These values are similar to that published by other authors, as for the clinical beginning of this disease. |