| front |1 |2 |3 |4 |5 |6 |7 |8 |review |
|
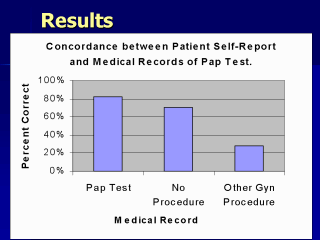
Really Explain the difference in each bar In this chart we are measuring correct self-reporting. SO, in the tallest bar on the left that the correct answer to according to their medical record was “yes, I got a Pap test”, about 81.8 percent of the women who received a Pap test reported it correctly. In the middle bar the correct answer according to their medical record was “no, I did not get a Pap test”, and 70.6 percent of women who did not receive a Pap test subsequently reported this non-event correctly (notice however, that this group of women did not receive any other gynecological procedure). In the smallest bar the correct answer according to their medical record would be “I did not receive a Pap test”, however, correct self-reporting dropped dramatically to 27.6 percent among women who received a different gynecological procedure but not a Pap test. The rate of false reporting of Pap tests by women who had received another gynecological procedure was significantly higher than for women who had received no procedure. The chi square was significant at less than .001. Overall agreement between medical records and participant self-reports was low (Kappa = .393). In this study the symmetry ratio was 2.93, indicating substantial over-reporting of Pap tests. |