 |
The irony of the
situation is that a household’s need for resources increase, so their capacity to
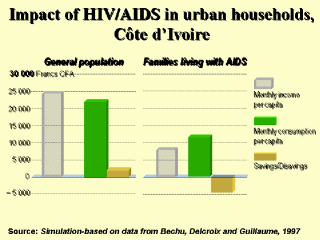
generate income is reduced. The above graph shows how monthly income per capita is reduced
in families living with AIDS. Even though consumption within these families is also
reduced to almost half that of families unaffected by AIDS, it is still higher than
monthly income per capita. To make up for the shortfall, families will rely on savings or
sell their assets. This may include the sale of livestock, farming implements, radios or
bicycles. This is known as disaving. |
