 |
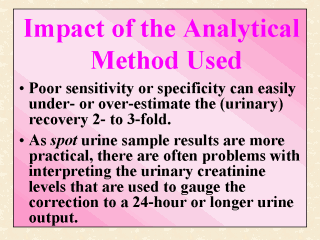
The sensitivity
and the specificity of the analytical technique used in human biomonitoring were mentioned
repeatedly. The importance of this issue may be illustrated here numerically. Suppose in
the numerical example presented in Slide 15, the percent urinary recovery is not 70%, but
around 3 to 7%. The chemical in a 24-hour urine volume of 1 to 1.2 liter is typically
measured in 5 to 10 ml aliquots. If the error of quantifying the contents in the 10 ml
aliquot were 20%, then altogether the true dose could be under- or over-estimated 2- to
3-fold. That is, the calculated dose of Ch-A (Chemical A) in Slide 15, at a percent
recovery of 5% supposedly yielding 0.1 mg of Met-A (Metabolite A) in 24 hours, could be
reported as 2.3 mg [= (0.08 mg for a 20% quantification error) x (2/1 for difference in
molecular mass)/(7% for recovery from a study)], when its true value is supposed to be 4.0
mg [= (0.1 mg) x (2/1 for difference in molecular mass)/(5% for the expected recovery)]. It
must be remembered that in some cases, only spot urine samples are collectable or
available. Some simulation techniques such as physiologically-based pharmacokinetic (PBPK)
modeling mentioned earlier (Lecture 3) can be used to interpret spot urine sample results
(see, e.g., Dong et al., 1994, 1996). Even with PBPK modeling, the
endogenous urinary creatinine levels are often used or required as a means to gauge the
correction to a 24-hour or longer urine output. Yet as stated in Slide 17, the urinary
creatinine level varies with time as well as with some physiological factors such as sex,
age, stress, and diseases. |