 |
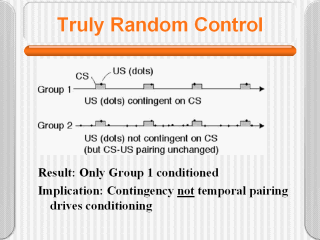
These are time lines. An elevation in the time
line indicates a period when a warning signal (CS) is presented. A dot
indicates a “reinforcement”, in this case, a short shock to the feet of the
rats. In Group 1, the US is temporally paired with the CS on several
occasions. There is also a statistical contingency between the CS and the
US, that is, the onset of the CS predicts an increase in the rate of shocks.
(Indeed, in the absence of the CS, there never is a shock) For Group 2,
there are exactly as many occasions in which the CS and US are paired as
there were for Group 1, so temporal pairing of CS and US is the same.
However, there is now no CS-US contingency: the rate of US occurrence when
the CS is on is no different from when it is not on. |
