 |
Estimates from the
1988 NHIS standard survey and 1988 CHS were compared. The difference was
used to calculate an inflation factor to modify the 1997-2000 asthma attack
prevalence estimates to make them more comparable with previous asthma
period prevalence estimates. We used two different subgroups (referred to as
study groups 1 and 2) of 1988 NHIS respondents. As described above, for the
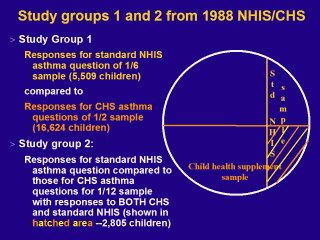
1988 NHIS sample of children aged 0-17 years, one sixth received the
standard NHIS asthma question (shown in yellow). One half received the
asthma questions from the CHS (shown in orange). Study group 1 contained
these two overlapping subsamples of children. Prevalence estimates for the
5,509 children responding to the asthma question on the standard survey (one
sixth of the 1988 sample) were compared with prevalence estimates for the
16,624 children responding to the CHS asthma questions (one half of the 1988
sample). Study group 2 contained approximately one twelfth of the NHIS
sample (2,805 children) that received both the standard and CHS
asthma questions (shown as the hatched area of overlap in the diagram).
|
