| front |1 |2 |3 |4 |5 |6 |7 |8 |9 |10 |11 |12 |13 |14 |15 |16 |17 |18 |19 |20 |21 |review |

|
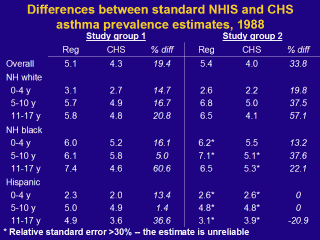
This table shows the results for study group 1 and study group 2. The estimates marked with an asterisk (*) have a relative standard error higher than 30% and are unreliable--while we can use them to measure the differences between the results for the different survey questions, they should not be used independently as estimates of asthma prevalence. The overall results for study groups 1 and 2 are shown on the first line of this table. For study group 1, the standard NHIS question yielded an asthma prevalence of 5.1% whereas the CHS questions yielded a prevalence of 4.3%. The standard NHIS question therefore gave an estimate 19.4% higher than that of the CHS two-part question. The difference for study group 2 was even greater, 33.8%. When the sample is stratified by race and age group, in almost every case, the estimate from the standard NHIS single question yielded a higher asthma prevalence estimate than the two step question from the CHS. The exception was for Hispanic children in study group 2. Recall that study group 2 was the group that received both the standard and the CHS questions. For this group, the estimates were the same or lower in the standard NHIS compared to the CHS, depending on the age group. This is somewhat surprising given that the greatest differences seen between the 1995-96 (old NHIS) and the 1997 (new NHIS) estimates were seen for Hispanics. One possible explanation is that the composition of the Hispanic population in the US changed between 1988 and 1995-97. The small sample sizes for Hispanics in study group 2 and the resulting unreliable estimates are another possible explanation of the contrasting results for this group. |