 |
When
interpreting pulmonary function tests, often, not all the criteria are met, and this may
limit the reliability of the test if the results are abnormal. If the spirometric results
are normal, the test can be interpreted as normal even though all criteria may not be met.
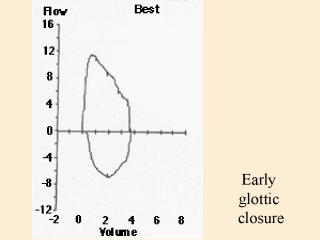
Test acceptability is best determined by examining
the flow volume loop and volume time curve. Variable effort, cough, and early glottic
closure can be seen on the graphs but may not be apparent by simply looking at values for
FEV1 and FVC. |
