 |
This slide
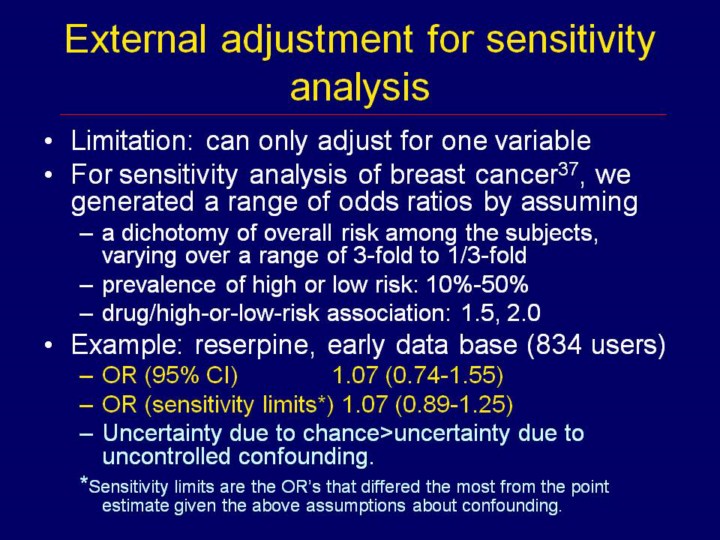
shows a comparison of the 95% confidence limits with the limits of the
sensitivity analysis based on external adjustment. In the external
adjustment shown, we used the most extreme assumptions as follows: The lower
sensitivity limit was based on the high risk subgroup’s relative risk of
breast cancer = 3.0, proportion of population in high risk subgroup = 25%,
and odds ratio of reserpine use by high risk subgroup = 2.0. The upper
sensitivity limit was based on the low risk subgroup’s relative risk of
breast cancer = 0.33, proportion of population in low risk subgroup = 50%,
and odds ratio of reserpine use by low risk subgroup = 2.0. Note that the
uncertainty due to chance is greater than the uncertainty due to a high
degree of confounding. We have often found this true except for very
commonly used drugs where large numbers of exposed cases can yield narrow
95% confidence intervals.
|