http://upload.wikimedia.org/wikipedia/commons/thumb/d/d9/Oort_cloud_Sedna_orbit.svg/1024px-Oort_cloud_Sedna_orbit.svg.png
| HPS 0410 | Einstein for Everyone |
Back to main course page
John
D. Norton
Department of History and Philosophy of Science
University of Pittsburgh
None of the universes discussed so far are ours. To determine which universe in Einstein's great book is our universe we need to know a little more about ours. Two facts have proven decisive in selecting our universe: the distribution of matter in the universe and its motion.
http://upload.wikimedia.org/wikipedia/commons/thumb/d/d9/Oort_cloud_Sedna_orbit.svg/1024px-Oort_cloud_Sedna_orbit.svg.png
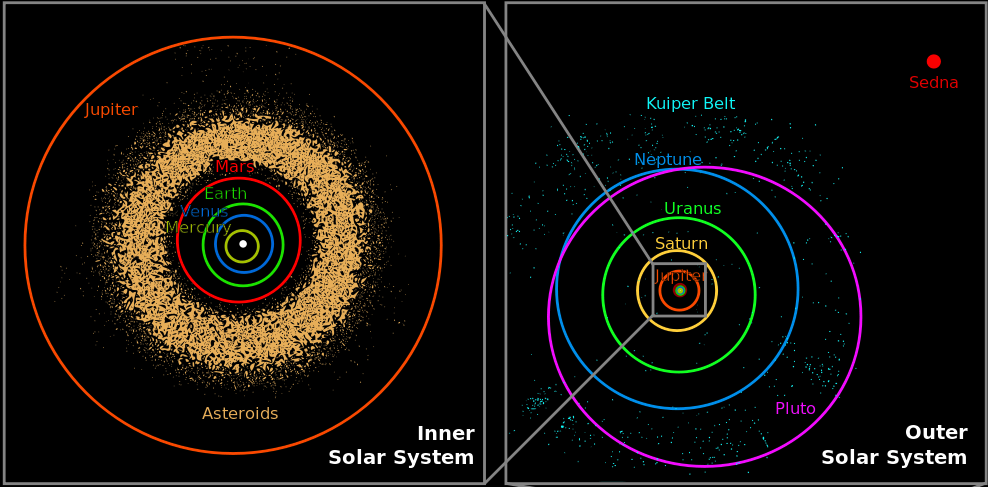
How is matter distributed in our universe on the largest scale? To answer we need to get a sense of just what that largest scale is. Let us step up to it:
Within our solar system, the distance from the sun to the earth is 93 million miles; light requires 8.3 minutes to propagate from the sun to the earth. Pluto is much farther away from the sun, 2700 to 4500 million miles depending on the position in its orbit.
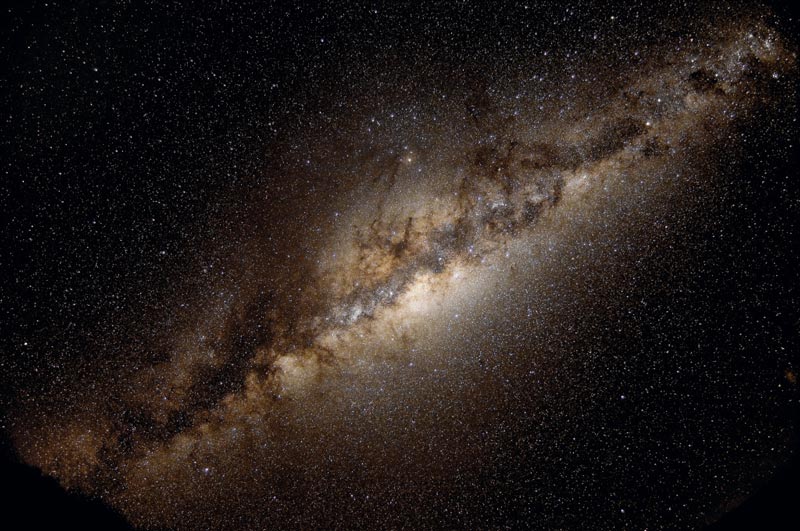
Our solar system is just one of hundreds of billions of stars that form our galaxy, the Milky Way. It is vastly bigger than our solar system. Its main disk is 80,000 to 100,000 light years in diameter. It is worth pausing to imagine what that means. A light year is the distance light travels in one year: 5,880,000,000,000 miles. Just one light year is already enormous. and there are 80,000 to 100,000 of them.
Here's how the Milky Way looks to us from the inside as a broad luminous band made up of many stars spread across the sky.
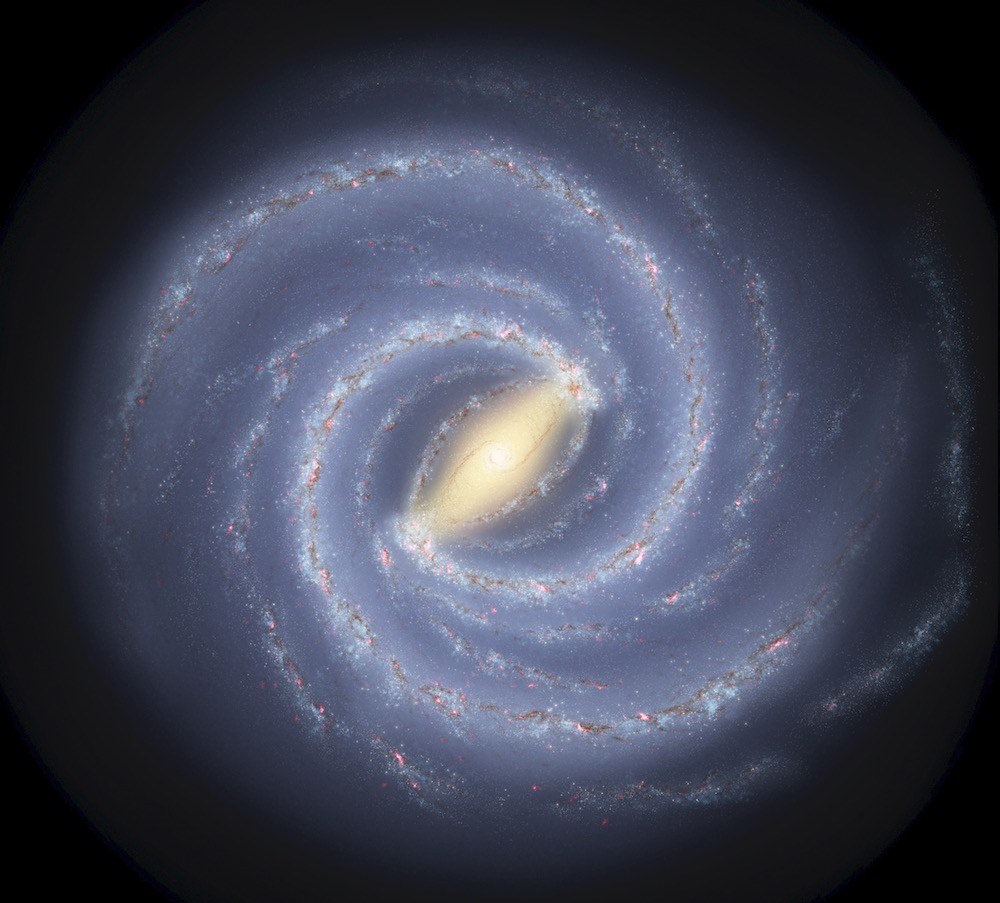
Here's an artist's conception of how it looks from the outside:
https://solarsystem.nasa.gov/resources/285/the-milky-way-galaxy/
It is sobering to reflect on just how enormous is this Milky way galaxy. We are rouighly 27,000 light years away from the galactic center. Imagine that we want to travel to some randomly chosen star elsewhere in the Milky way. It might be 50,000 light years away. The fastest speed at which we can travel is the speed of light. At that speed, the journey would take 50,000 years. That is already ten times greater thanthe span of recorded history. (Our first written historical records are only 5,000 years old.) If we are unable to accelerate to close to the speed of light, the whole trip would take corresondingly longer.

https://upload.wikimedia.org/wikipedia/commons/6/60/ESO_-_Milky_Way.jpg
Let us be a little more circumspect. What if we only want to signal to possible inhabitants of this distant star that we are here. The "hello"signal would still take 50,000 years.

That would just be the first round of what we hope would be a conversation. If the inhabitants of the distant star receive and respond immediately to our signal, their reply would take another 50,000 years. This first rudimentary exchange would take 100,000 years.

The remaining stars of the universe are grouped into other galaxies. Here's a nearby galaxy, the Andromeda galaxy, M31, which is about 2.5 million light years away:
It is easy to image that this nearby galaxy is just a tiny blip in the night sky. However that is not so. It is a large object in the night sky. To convey its size, NASA displayed a composite image of the Andromeda galaxy and the moon superimposed, such that they are at the same relative size as they appear in the night sky. The moon is a large object in the sky and subtends an angle of about 1/2 degree for observers on earth. Andromeda is clearly much larger. We cannot see its immense size with naked eye observation since the the stars in the Andromeda galaxy are too faint. All we see is a small smudge. (Picture and explanation at https://apod.nasa.gov/apod/ap130801.html.)

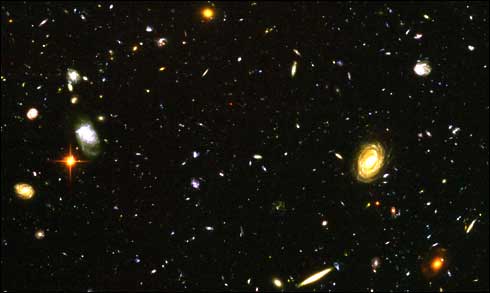
| Finally, on the largest scale, luminous matter is
roughly uniformly distributed through
space in galaxies separated by millions of light years. Typical
distances between galaxies are of the order of an astronomical unit
known as the "megaparsec" (Mpc). Here's an image of a scattering of galaxies from the Hubble telescope: |
A parsec is a unit of distance defined through
angles. If an observer is far away from the Earth-Sun system, the
mean distance between the Earth and Sun will subtend some angle in
the observer's field of view. If the observer is very, very far
away, the angle subtended will be very, very small. When that angle
is one second of arc (= 1/3600th degree), the observer is one parsec
(pc) away. One megaparsec (Mpc) = 3,261,563 light years. |
The images above were drawn from the NASA website, http://www.nasa.gov/, January 14, 2007. NASA provides these images copyright free subject to the restrictions on http://www.simlabs.arc.nasa.gov/copyright_info/copyright.html
This assumption of rough uniformity of the distribution of the galaxies will be sufficient for what follows. The uniformity, however, is only rough. As we move to larger scales, we find some clustering of galaxies.
Our galaxy, the Milky Way, is part of a small grouping of galaxies known as the "Large Magellenic Cloud." More expansive surveys show the existence of further clusters, superclusters and voids in between them. It is only on the scale of hundreds of megaparsecs that these inhomogenities smooth out and we get the rough uniformity upon which much of subsequent cosmological theorizing is based.
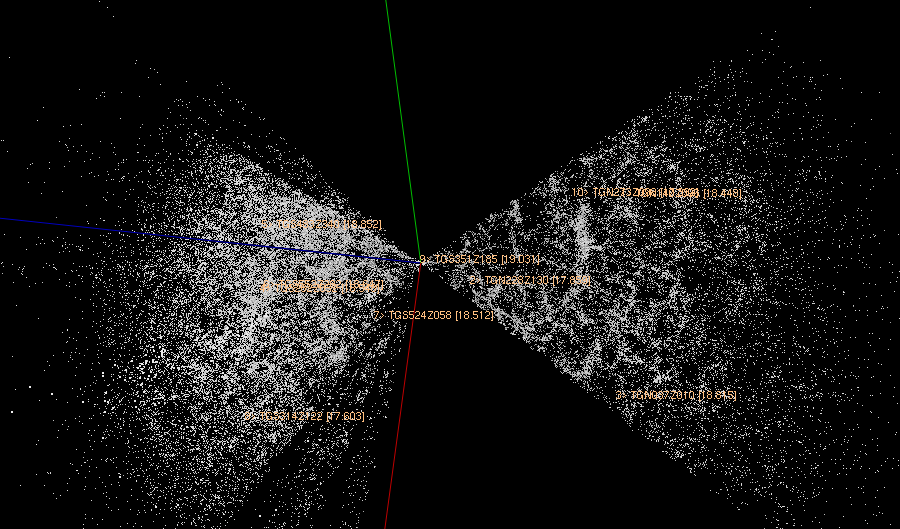
The Two-degree-Field Galaxy Redshift Survey, conducted
from 1997-2002, gives some idea of distribution of galaxies. The survey
penetrated to a depth of about 2.5 billion years
(=767 Mpc). Here's a depiction of the distribution of galaxies they found.
The hourglass shape comes because the survey looked for other galaxies
above and below the plane of our Milky Way galaxy.
https://en.wikipedia.org/wiki/File:2dfgrs.png
This familiar picture of the universe on the largest scale is a quite recent discovery. As late as 1920, it remained unclear whether all the matter of the universe was collected in one place, the Milky Way; or whether the Milky Way was just one galaxy of many scattered through space. This question was the subject of what came to be known as the "Great Debate" that happened in the Baird auditorium of the Smithsonian Museum of Natural History on April 26, 1920 . There two astronomers battled. Harlow Shapley defended the theory of island universe and Heber Curtis argued for the many galaxies of stars view that ultimately prevailed.
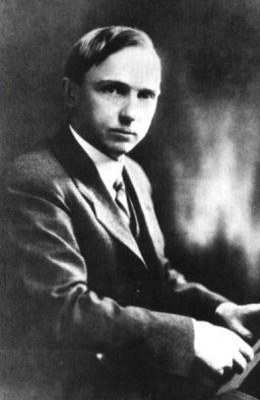 Harlow Shapley |
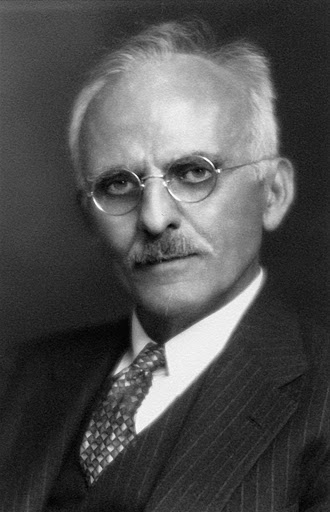 Heber Curtis |
These galaxies are the basic units of matter of modern cosmology. They are the molecules of the cosmic gas that is the subject of modern cosmology. The theory proceeds by assuming that they form a continuous fluid, much as we routinely assume that water or air is a continuous fluid, even though we know it is made of molecules; or that sand dunes are continuous, even though they are made of grains of sand. As long as we take a distant enough view of galaxies, molecules or sand grains, they blend into their neighbors and appear to form a continuous distribution of matter.

The galaxies form the luminous part of the matter of the universe. Recent investigations lead to speculations that there is a lot more matter in the cosmos. It is prefixed by "dark...". Dark energy is matter that is speculated to permeate all space and play a major role in cosmic dynamics. Dark matter is posited to provide the additional gravitational pull needed to hold galaxies together.
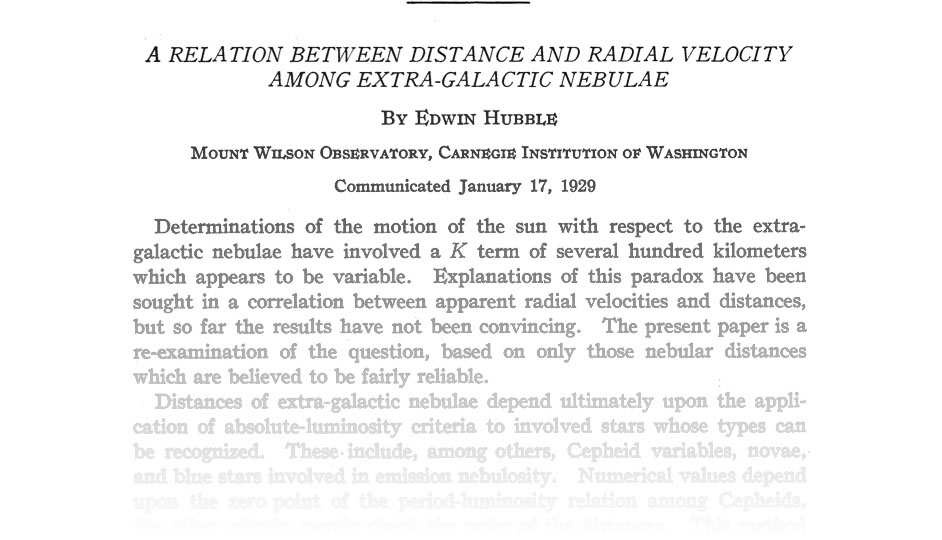
Einstein, in 1917, presumed that on the largest scale we would see a uniform distribution of stars all roughly at rest. In the course of the 1920s, in the aftermath of the Great Debate, it became clear that the basic unit of cosmic matter would be the galaxy and not the star. That by itself changed little at the fundamental level of theory. What did change our cosmic theorizing a lot was an observation about light from distant galaxies pursued most famously by Edwin Hubble towards the end of the 1920s. That observation became the single most important observational fact of modern cosmology.
 Edwin Hubble |
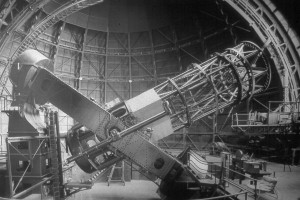 Mount Wilson telescope |
What Hubble observed was that light from distant galaxies was redder than light from nearby galaxies.

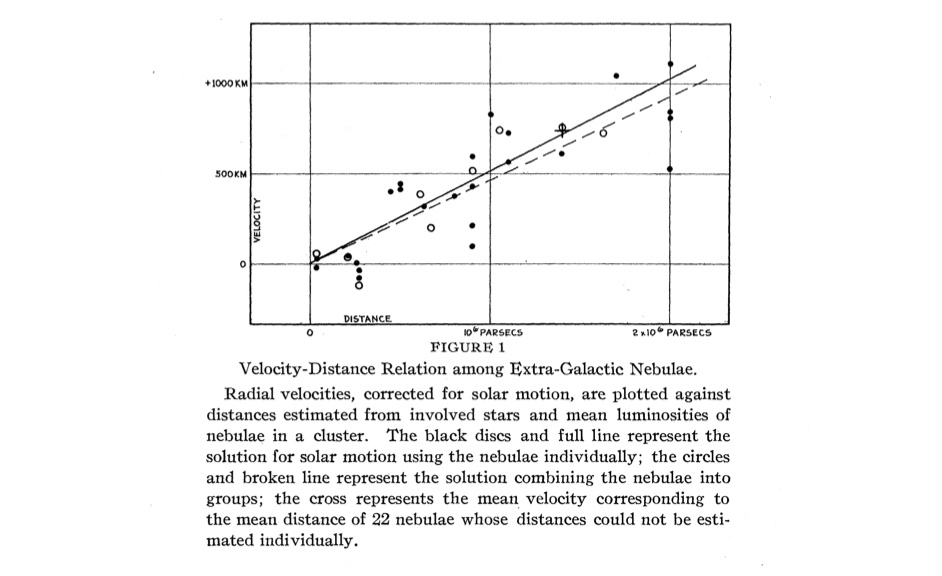
More importantly, there was a linear relationship between the distance to the galaxy and the amount of reddening. Double the distance and you double the reddening; triple the distance and you triple the reddening; and so on.
How was this reddening to be interpreted? Hubble inferred that it revealed a velocity of recession of the galaxies. The redder the light the faster the galaxies were receding.
Hubble arrived at this interpretation through an effect familiar from optics and acoustics, the Doppler effect. Every sound or light wave has a particular frequency and wavelength. In sound, they determine the pitch; in light they determine the color. Here's a light wave and an observer.

If the observer were to hurry towards the source of the light, the observer would now pass wavecrests more frequently than the resting observer.

That would mean that moving observer would find the frequency of the light to have increased (and correspondingly for the wavelength--the distance between crests--to have decreased). That increase in frequency is a shifting of the light towards the blue end of the spectrum.
The converse effect would happen if the observer were to recede from the light source. The light's frequency would diminish and the light would redden.
| For light, this effect depends only on the relative motion of observer and source. So if the observer were at rest and the light source moved, exactly the same thing would happen. | This is no longer true in the case of sound. Then there is a medium that carries the sound waves, the air, and we get slightly different results according to which of the observer or sound emitter is moving with respect to the air. There is nothing analogous to the air for light--there is no luminiferous ether! |

The Doppler effect is familiar from everyday life. When an ambulance approaches us with its siren on, we hear a higher pitch because it is approaching. As it passes and then recedes, we hear the pitch suddenly drop. There has been no change in the sound emitted by the siren. The ambulance driver hears no change in the siren pitch. All these changes happen as a result of the relative motion between you and the ambulance siren by means of the Doppler effect.
Hubble inferred from the red shift of light from distance galaxies to a velocity of recession of the galaxies. The further a galaxy is from us, the faster it recedes. The relationship is linear, a fact to be explored in a moment.

Hubble arrived at the basic fact that all modern cosmologies try to accommodate: the universe is undergoing a massive expansion.
I'll mention here for later reference that the use of Doppler's principle as a way of interpreting the red shift has limited application. When we have developed a full cosmological model using general relativity, we'll see that the presumptions above of a static space with observers and galaxies moving in it will fail. Instead we shall see that the reddening of light from distant galaxies comes from a stretching of space itself while the light propagates to us. Doppler's principle provides a useful, classical approximation of the effect.
Hubble found a linear relationship between the velocity of recession and the distance to the galaxy. What that means can be seen in the table:
| Distance to galaxy (light years) |
Velocity of recession (kilometers/second) |
| 1,000,000 | 20 |
| 2,000,000 | 40 |
| 3,000,000 | 60 |
| 4,000,000 | 80 |
| 5,000,000 | 100 |
There is an obvious rule built into this table and it is known as "Hubble's Law":
| Velocity of recession (kilometers/second) |
= | 20 | x | Distance to galaxy (millions of light years) |
The magic number of 20 in this formula carries a lot of the content. In effect it is telling us that we need to assign 20 kilometers per second of velocity of recession for every million light years of distance between us and the galaxy. This number, which is one of the most important cosmic parameters, is known as Hubble's constant.
This value of 20 is the modern value. Hubble's value from 1929 was over 7 times larger at roughly 150. (He expressed his valule as roughly 500 km/sec.Mpc.) He arrived at this much larger figures since his methods for determining the distances to the galaxies contained systematic errors that led him to uniformly underestimate the distances.
Built into Hubble's law is also a notion of the age of the universe. To see it, consider a galaxy a million light years distant from us. If its speed of recession was the same in all history, we can compute how long ago the matter of that galaxies was here. Similarly we can compute how long ago the matter of a galaxy two million light years distant was here. And we can compute how long ago the matter of a galaxy three million light years distant was here.
A remarkable fact follows from the linearity of Hubble's law. All the times computed will come out to be the same. They will simply be one divided by Hubble's constant (with the units appropriately adjusted). The time we have computed is a time at which all the matter of the universe was coincident. That marks the beginning of the universe--we now call it the "big bang." This is very pretty. We proceed from observations about galaxies to Hubble's law with its constant on to the age of the universe.
| Age of Universe | = | 1 | / | Hubble's constant |
The Hubble age of the universe is roughly 14 billion years.
The distribution of matter on the largest scale is observed to be roughly uniform. But what of the motions? Does Hubble's law tell us that our galaxy is in a preferred center as far as the motion of recession of the galaxies is concerned? Hubble's law is expressed as a linear relationship between velocity and distance. A special property of motions with this linear relationship is that there is no preferred center of the motion.
To see what that means, imagine that our galaxy is the bluish one in the figure below. All the other galaxies are receding from us with velocities that increase linearly with distance, including the nearby greenish colored galaxy.

Now imagine that we relocate our viewpoint to this greenish galaxy. We would still find all the galaxies around us recede with a velocity proportional to distance. The motions of the galaxies follow same Hubble law whether we are on the bluish galaxy, the greenish galaxy or any other galaxy.

Combining, the distribution of matter in the galaxies of the universe on the largest scale is roughly homogeneous and isotropic: it is the same in every place and in every direction. The same is true of the overall motions of the galaxies: they are the same everywhere.
The principal facts of observational astronomy from which modern cosmology grew are those just sketched: the uniform distribution of cosmic matter on a large scale and its expanding motion. Since the 1960's, another type of observation has taken an increasingly important role in cosmology. In 1964, Arno Penzias and Robert Wilson, working at the Crawford Hill location of the Bell Telephone Laboratories in New Jersey, found background, electromagnetic noise in the large horn antenna being used for research into communication satellites for NASA. Here is their horn antenna:
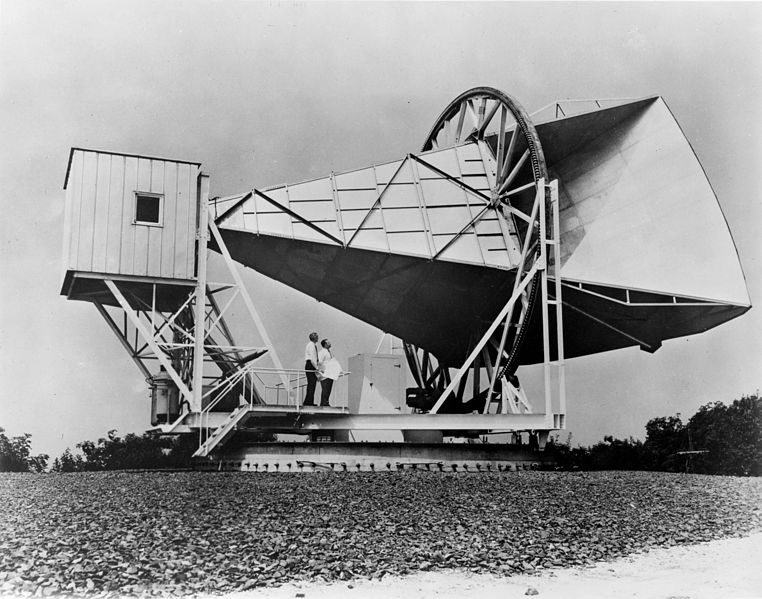
https://en.wikipedia.org/wiki/File:Horn_Antenna-in_Holmdel,_New_Jersey.jpeg
The noise, it turned out, had no discernible, terrestrial source. It was extraterrestrial. It was coming uniformly in all directions from space itself. They had found the "cosmic microwave background radiation."
The radiation is labeled "microwave" since its energy peaks in the microwave part of the electromagnetic spectrum. Specifically, the peak is at 160 GHz. In frequency terms, this locates the radiation somewhere between the lower frequency radio waves and the higher frequency radiation that comprises visible light. They are in the same frequency range as the radiation in a microwave oven, but are of such weak intensity that they would be useless for culinary purposes!
Further, the electromagnetic waves comprising the noise turned out to consist of a quite precise mix of frequencies, characteristic of heat radiation. Its temperature was eventually determined to be 2.7K. The "K" represents degrees Kelvin, the unit used to measure temperature above the lower limit possible for temperatures, "absolute zero." 0K = "zero degrees Kelvin." It corresponds to -273.15C = -273.15 Celsius.
| Heat radiation is something familiar to everyone. When you warm your cold hands in front of a glowing fire, it is the invisible, infrared radiation emanating from the fire that warms your hands. The radiation will have a definite temperature, whose magnitude depends on the source. It is commonly hundreds of degrees Celsius. | We shall meet with heat radiation again shortly when we look at quantum theory. Planck's efforts to treat heat radiation using classical electromagnetic theory provided the first clues that the classical approach had problems that eventually developed into modern quantum theory. |
Heat radiation is everywhere. If you are sitting comfortably in a room at a temperature of 20C = 68F, then the walls of the room are emitting heat radiation of roughly that characteristic temperature towards you. Because your skin has a definite temperature, you are returning heat radiation to the walls.
The cosmic background radiation is the same sort of radiation. The only difference between it and these more familiar instances of heat radiation is that it is extremely cold. A temperature of 2.7K is merely 2.7K above the lower limit possible for temperatures, absolute zero.
All this fits very nicely into big bang cosmology. Big bang cosmology tells us that the universe, immediately after the big bang 14 billion years ago, was extremely hot. It was filled with heat radiation at very high temperatures. As the universe expanded, this radiation was cooled by the expansion. As the expansion of the universe continued, the temperature of the heat radiation was driven to ever lower temperatures. The very cold radiative residue of the heat of that initial inferno is the cosmic background radiation measured by Penzias and Wilson.
At first it may seem that there is not that much to learn from such feeble radiation. It makes sense that a big bang, long ago, might leave a slight residue of heat radiation. Indeed, one should expect feeble electromagnetic radiation whenever we have matter containing charged particles like protons and electrons. Every time they change their energy states, electromagnetic theory tells us that they will emit or absorb radiation. So, whatever our larger cosmological theory, should we not expect to be immersed random scatterings of electromagnetic radiation, even if the radiation is very weak?
What this view overlooks is that having a thermal character is not just any random scattering of radiation. To be thermal at some particular temperature, the energy of the radiation has to be distributed over the infinitely many frequencies in a quite specific way. Any old distribution over the frequencies will almost certainly not meet the thermal specifications. That fact has proved critical to much observational and theoretical work in cosmology over the past few decades.
When the cosmic microwave background was first detected in the 1960s, it had been conjectured that this radiation would exist, be thermal in character and be at a temperature close to absolute zero. To show that this radiation did indeed manifest a thermal spectrum, the background needed to measured over many frequencies. Over the years following Penzias and Wilson's first measurements, more measurements were made and the thermal character of the radiation was eventually confirmed quite securely.
One of the most striking confirmations came from the measurements of the Cosmic Background Explorer satellite "COBE," launched in November 1989. The measurements required are quite delicate. If one is to see radiation coming from a source at 2.7K, the instruments themselves must be at least that cold. If they are warmer, the radiation they emit will swamp any radiation from the 2.7K source. To keep the instrumentation cold, the COBE satellite carried a 650 liter superfluid helium cryostat! The result was an extraordinarly good match of the measured distribution of energy over the various frequencies and the thermal distribution associated with 2.7K. The theoretical curve (green line) passes precisely through the COBE measurements (red crosses).

https://commons.wikimedia.org/wiki/File:Cmbr.svg
Public domain image
We learn a great deal from marvelously good fit of the data to the thermal curve.
First, the thermal background is isotropic, that is, it is the same in all directions. The photons that the COBE sensors detected have been propagating in space for a very long time. That the photons coming from all directions measured have the same energy distribution tells us that the universe was same everywhere were these photons were emitted. That is, we have a probe that tells us that, far, far away and long, long ago, the universe was homogeneous.
To say how far and how long ago our probe has reached
requires that we employ some cosmological theory. Our current theories
tell us that these photons were set loose from the "surface
of last scattering" at a time merely 380,000 years after the big
bang, when the cooling universe had a temperature of around 3000K. That
means that the photons have been traveling, undisturbed, for most of the
entire history of the universe!
Second, is something intriguing. A thermal distribution of energy over the various frequencies is not just any frequency distribution. It is specifically the one produced when systems come to thermal equilibrium. For example, the velocities of the molecules of air in a room are thermally distributed because the the molecules have been banging into one another long enough to settle down into their final thermally distributed equillibrium. Correspondingly, we expect that radiation adopts a thermal distribution because the matter sources that emit and absorb the radiation have likewise come to thermal equilbrium.
One might expect that this condition of thermal equilibrium would be easy to satisfy in the early universe when all matter was crammed closely together. However, it turns out that even with the high densities of the early universe, ordinary cosmological theory has great trouble with this result. It has to give the matter of the early universe enough time to interact with the rest of the matter before the expansion of the universe flings the matter off into distant parts of space. Standard (non-inflationary) cosmology has proven unable to do this. That it cannot is known as the "horizon problem."
The near perfection of the fit of the measurement with an isotropic thermal distribution has told us a lot. It turns out to be just the beginning. While the distribution of energy in the cosmic microwave background radiation is almost exactly thermal, the "almost exactly" hides a further wealth of useful information.
Very, very precise measurements have shown there to be
very, very slight deviations from isotropy. These measurement have been
carried out by the satellites of the Wilkinson Microwave Anisotropy Probe
(WMAP), from 2001 to 2010; and more recently
and more precisely by the Planck satellite of
the European Space Agency, from 2009 to 2013.
Here is a thermal map of the sky that assembles 9 years of data collected by WMAP:
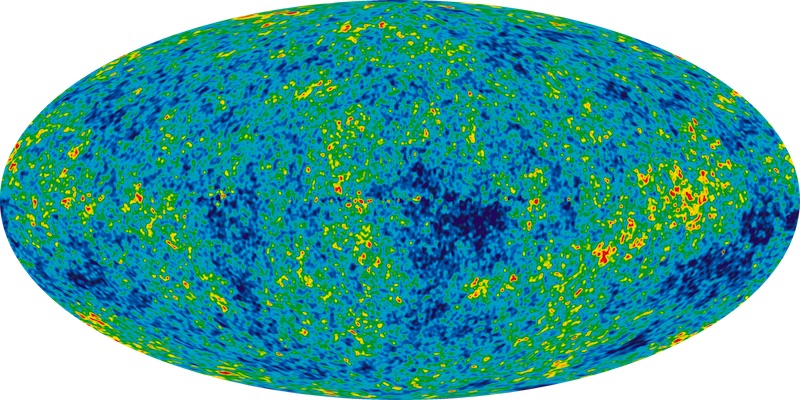
https://en.wikipedia.org/wiki/File:Ilc_9yr_moll4096.png public domain
The different colors in the map represent different temperatures. It would seem at first glance, that the sky is quite anisotropic in temperature. However the range of temperatures shown by the different colors is minute. The full range is plus or minus 0.0002K around the mean temperature of 2.725K.
These tiny deviations in temperature look like a tiny amount of noise in an otherwise quiet place. In the case of sound noise, we can understand it better by splitting up into its component frequencies--the notes that combine to make the noise. The same can be done with the scattering of temperature variations across the sky. We can plot the spatial distribution as a spectrum of modes, analogous to the notes that combine to form a chord or noise.
Here is a graph that shows measurements from WMAP in black over the different spatial modes ("multipole moments"). The colored results are from of balloon and ground based measurements. (Figure 18 from G. Hinshaw et al. "Three-Year Wilkinson Microwave Anisotropy Probe (WMAP) Observations: Temperature Analysis," https://arxiv.org/pdf/astro-ph/0603451.pdf)
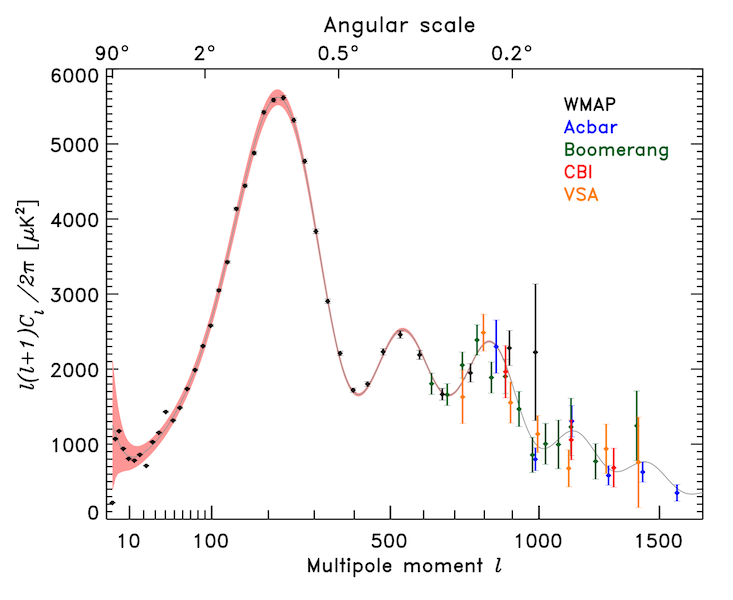
https://commons.wikimedia.org/wiki/File:PowerSpectrumExt.svg
public domain image
While these deviations from uniformity are minute, they are actually of critical importance in cosmology. The matter of universe is now clumped together in stars and galaxies. These clumps are produced by the mutual gravitation of the matter that forms the stars and galaxies. If that matter is perfectly, uniformly distributed in the early era probed by the cosmic microwave background, then it would stay in perfect balance. The mutual gravitational attraction would have no net effect. Small inhomogeneities are needed to seed the gravitational collapse that leads to stars and galaxies.
It turns out that the tiny inhomogeneities in the cosmic microwave background are just the size needed to seed the later formation of stars and galaxies--"structure formation," as it is called. The challenge for a cosmology is to reproduce just these fluctuations and their spectrum. The strongest evidence in favor of inflationary cosmology is that it can take quantum fluctuations in a homogeneous matter distribution of the early universe and amplify them to reproduce the anisotropies seen in the cosmic microwave background.
Copyright John D. Norton. March 2001; January 2007, February 16, 23, October 16, November 10, 2008, March 31, 2010, January 1, March 18, 2013. January 3, 2016. January 16, 2017. October 16, 2020. February 5, 2022. March 7, 2024.