 |
The
first analysis was a comparison of the basal characteristics of the three groups using the
X2 tests for qualitative variables and Snedecor's F test for quantitative variables. To
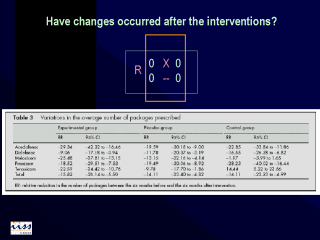
analyse the main outcome, the relative reduction (RR) in the number of prescriptions of
each type of NSAID was calculated as the average number of packages of each drug
prescribed per doctor and per month during the six months after the intervention, minus
the average number of packages pre-scribed per doctor, per month during the six previous
months, divided by the latter. Significant differences were established in function of the
confidence intervals of 95% (95%CI) of this reduction. |
