| front |1 |2 |3 |4 |5 |6 |7 |8 |9 |10 |11 |12 |13 |14 |15 |16 |17 |review |
 |
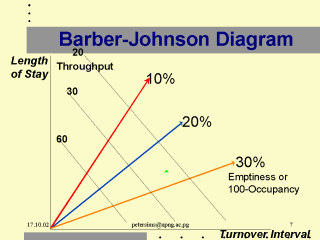
The Barber
Johnson diagram attempts to put the key factors in bed use together and enable a unit to
examine its performance over time. The Throughput Contour lines 20, 30 and 60 patients per bed per year will be determined by the Length of Stay. A high Throughput will mean a short length of stay and a short Turn Over Interval.
|