 |
-
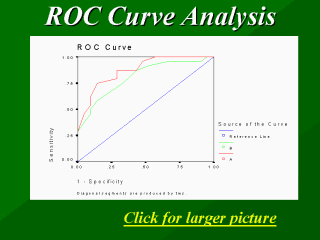
Using the curve to compare two tests. ROC curves also can be used to compare two
diagnostic tests. The area under the curve represents the overall accuracy of a test; the
larger the area, the better the test (Knapp and Miller, 1992).- The ROC curve for a test that conveys no
information falls on the diagonal running from lower left to upper right.
- In comparing two ROC
curves, the one closest to the upper left corner (i.e., the curve with the greatest total
area below and to the right of it) has the greater sensitivity and specificity and hence
is the more accurate of the two. |
