| front |1 |2 |3 |4 |5 |review |
 |
- Receiver-Operator Characteristic
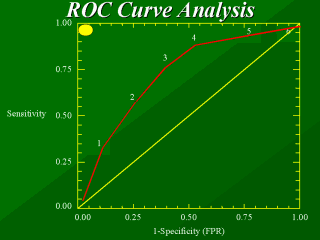
(ROC) Curve “ . . . is a graphic representation of the relationship between sensitivity and specificity for a diagnostic test. It provides a simple tool for applying the predictive value method to the choice of a positivity criterion” (Knapp and Miller, 1992). - Steps in Constructing ROC Curves (Knapp and Miller, 1992): 1. Draw the curve by plotting the true positive rate (sensitivity) against the false positive rate (1-specificity) for several choices of the positivity criterion. 2. Using the curve to locate the positivity criterion. The point marked by the yellow circle in the upper left corner represents a perfect diagnostic test. At this point, both sensitivity and specificity are 100%, that is, all diseased individuals are identified, all healthy individuals are labeled disease-free, and no disease-free individuals are labeled diseased. - When the costs of a false positive and false negative test result are equal, set the positivity criterion equal to the point on the ROC curve closest to the upper left corner (See point #3). At this point, the discriminate ability of the test is maximized and the number of erroneous diagnoses is minimized. - When a false positive (mis-diagnosis) result is especially undesirable, set the positivity criterion equal to the point farthest to the left on the ROC curve (See point #1 or 2). - When a false negative (missed diagnosis) result is especially undesirable, set the positivity criterion equal to a value toward the right on the ROC curve (See point #5 or 6). At the point on the ROC curve farthest to the right, all patients with the disease are detected by the diagnostic test. |