| front |1 |2 |3 |4 |5 |6 |7 |8 |9 |10 |11 |12 |13 |14 |15 |16 |17 |18 |19 |20 |21 |22 |23 |24 |25 |26 |27 |28 |29 |review |
 |
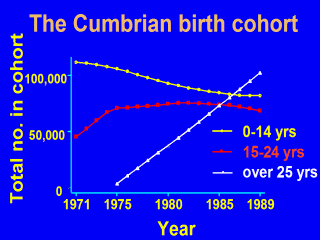
Did your graphs
look something like this? Remember that the cohort includes all children born from 1950 onwards, so there was nobody over age 25 years until 1975. After 1975, there were more people each year over age 25. The number of children aged 0-14 years falls slowly because the birth rate fell slowly from 1971 onwards. Why does the number of people aged 15-24 years increase up to 1975 and then stay roughly constant? For more about age groups and cohorts, see Clayton D, Hills M. Statistical Methods in Epidemiology. Section 31.4, pages 311- 314. Oxford University Press. 1993. |