| front |1 |2 |3 |4 |5 |6 |7 |8 |9 |10 |11 |12 |13 |14 |15 |16 |17 |18 |19 |20 |21 |22 |23 |24 |25 |26 |27 |28 |29 |30 |31 |32 |33 |34 |35 |36 |37 |38 |39 |40 |41 |review |
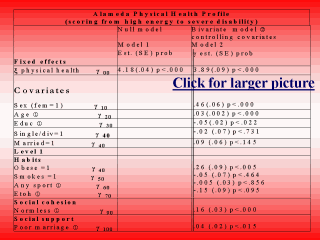 note: a limited HLM version was applied to this data set pending release of HLM 5.0; The cross-level model took the following general form: Alameda Physical Health Profile = [g 00 + g 10 (women) + g 20 (age) + g 30 (educ) + g 40 (habits, social cohesion, social support, social network variables) + g 01 (ratio fam. size) + g 02 (ratio blue collar low educ) + g 03 (area x alcohol) + g 04 (ratio apt. size) + g 14 (sex)(aptratio) + g 21 (age)(famratio) + g 33 (educ)( area x alcohol) ] + [ u0jXpij + u0j + eij ]. |
TABLE 3: Random
intercept model, hierarchical linear regression of Alameda Physical Health Profile on
personal habits, social connections, and relative inequality, Moscow, 1991 ¬ centered around grand x ; significant covariates entered as a block, each level 1 and level 2 variable tested separately; ® random variance for intercept reported as average because it did not change significantly with separate variable sets; Appendix 1: Notes for Tables 3/4 ¬ centered around grand x - Alcohol Area x =0.264 liters; age=45.22 years; education = secondary/ technical level; (estimates represent units of health from good to poor as compared to the grand mean of the base intercept category) ? Goodness of model fit was assessed by the deviance statistic (a likelihood ratio test of the lack of fit between data and model, defined as minus twice the natural logarithm of the likelihood) with a c 2 distribution; |
| front |1 |2 |3 |4 |5 |6 |7 |8 |9 |10 |11 |12 |13 |14 |15 |16 |17 |18 |19 |20 |21 |22 |23 |24 |25 |26 |27 |28 |29 |30 |31 |32 |33 |34 |35 |36 |37 |38 |39 |40 |41 |review |