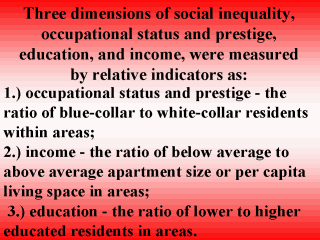
 |
The ratio of
large families, with five or more members as compared to families of all sizes living
within areas, was an indicator of a risk for poverty. This was consistent with published
reports of larger than average families being more likely to report poverty. Ratios were
used because they quantified not only the distribution of each social dimension of
inequality but the range of the distribution within each urban area. Average inequality
was measured by standardized factor scores of access to material resources and the new
development of resources within urban areas (see next slide -Table 1). |