| front |1 |2 |3 |4 |5 |6 |7 |8 |9 |10 |11 |12 |13 |14 |15 |16 |17 |18 |19 |20 |21 |22 |23 |24 |25 |26 |27 |28 |29 |30 |31 |32 |33 |34 |35 |36 |37 |38 |39 |40 |41 |42 |43 |44 |45 |46 |47 |48 |49 |review |
 |
The relatively small YLL burden attributable to MNSD may incorrectly lead to the interpretation that premature death in people with MNS disorders is inconsequential. Evidence shows that people with MNS disorders experience a significant reduction in life expectancy, with risk of mortality increasing with disorder severity.
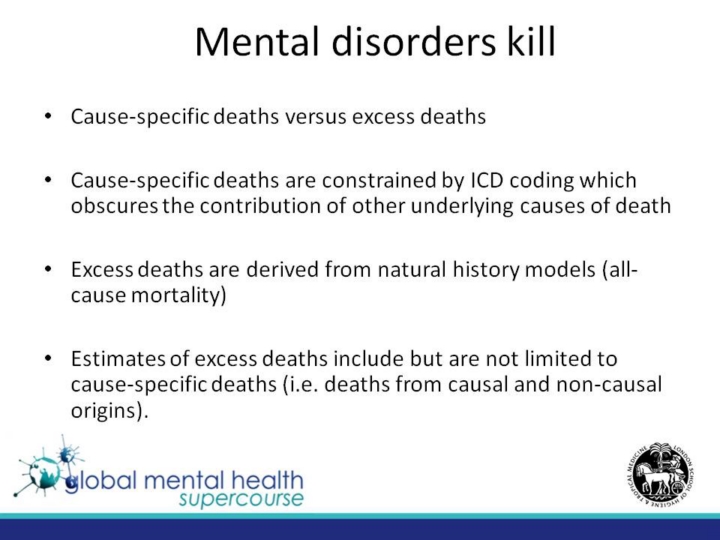
Mortality is quantified using two different, yet complementary, methods employed as part of the GBD analyses. First, cause-specific mortality draws upon vital registration systems and verbal autopsy studies that identify deaths attributed to a single underlying cause using the ICD death coding system. Second, GBD creates natural history models of disease, drawing on a range of epidemiological inputs, which ultimately provide epidemiological estimates for parameters including excess mortality—that is, the all-cause mortality rate in a population with the disorder above the all-cause mortality rates observed in a population without the disorder. By definition, the estimates of excess deaths include but are not limited to cause-specific deaths.
Cause-specific mortality estimated via the ICD obscures the contribution of other underlying causes of death (for example, suicide as a direct result of depressive disorder) and likely underestimates the true number of deaths attributable to a particular disease. However, the estimation of excess mortality using natural history models often includes deaths from both causal and non-causal origins and likely overestimates the true number of deaths attributable to a particular disorder. The challenge is to parse out causal contributions to mortality (beyond those already identified as cause-specific) from the effects of confounders. |