| front |1 |2 |3 |4 |5 |6 |7 |8 |9 |10 |11 |12 |13 |14 |15 |16 |17 |18 |19 |20 |21 |22 |23 |24 |25 |26 |27 |28 |29 |30 |31 |32 |33 |34 |35 |36 |37 |38 |39 |40 |41 |42 |43 |44 |45 |46 |47 |48 |49 |review |
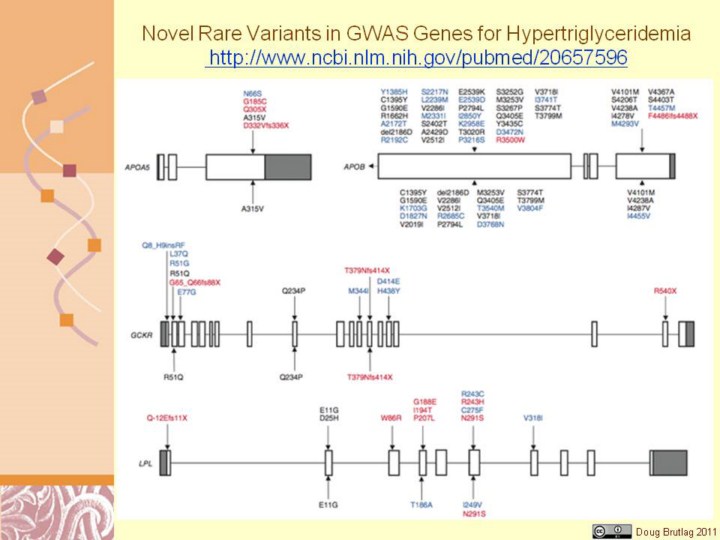 |
http://www.ncbi.nlm.nih.gov/pubmed/20657596 Figure 1 Rare variants identified by resequencing GWAS-identified genes in individuals with HTG and controls. Variants listed above gene maps were identified in affected individuals, and those below gene maps were identified in controls. Rare variants are colored as follows: black, identified in control subjects or previously identified in subjects of unknown clinical status; blue, exclusive to affected individuals or controls; red, proven biological dysfunction or truncation. Nomenclature for variants refers to functional protein sequences. Only exons 26 and 29 were resequenced in APOB. Gene maps are roughly to scale, although they differ in scale between genes.
Genome-wide association studies (GWAS) have identified multiple loci
associated with plasma lipid concentrations1–5. Common variants at these
loci together explain <10% in APOA5, GCKR, LPL and APOB associated with HTG. Resequencing of these genes revealed a significant burden of 154 rare missense or nonsense variants in 438 individuals with HTG, compared to 53 variants in 327 controls (P = 6.2 × 10⁻⁸), corresponding to a carrier frequency of 28.1% of affected individuals and 15.3% of controls (P = 2.6 × 10⁻⁵). Considering rare variants in these genes incrementally increased the proportion of genetic variation contributing to HTG. |