| front |1 |2 |3 |4 |5 |6 |7 |8 |9 |10 |11 |12 |13 |14 |15 |16 |17 |18 |19 |20 |21 |22 |23 |24 |25 |26 |27 |28 |29 |30 |31 |32 |33 |34 |35 |36 |37 |38 |39 |40 |41 |42 |43 |44 |45 |46 |47 |48 |49 |50 |51 |52 |53 |54 |55 |56 |57 |58 |59 |60 |61 |review |
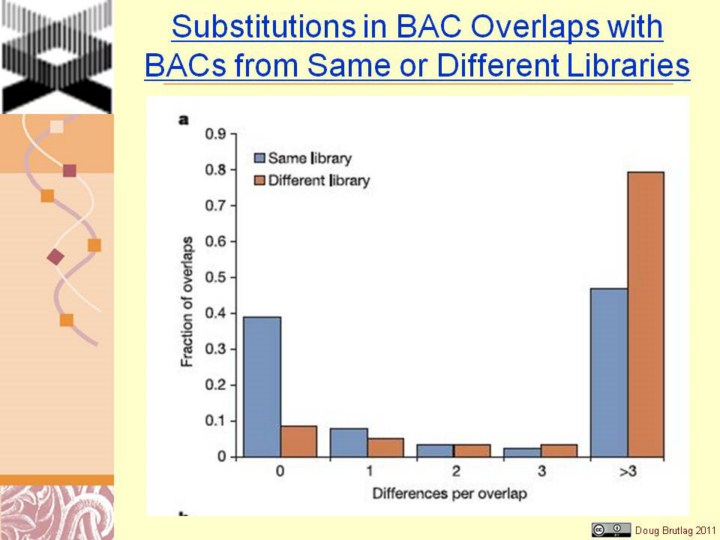 |
Substitutions in BAC Overlaps with
Figure 2 Assessment of potential errors by analysis of BAC overlaps. a, Single-base differences between overlapping finished BAC clones (with 45 kb overlap). The number of single-base differences in overlaps for clones from the same library and from different libraries is plotted. The results are consistent with half of the clones from the same library representing identical underlying DNA sequence with low error rate, and half representing different haplotypes as expected. b, Insertion/deletion (indel) differences between overlapping clones. The number of indels per Mb for a given size range is compared for clones with no single-base mismatches (presumed to be derived from the same haploid source) and .3 single-base mismatches (presumed to be derived from different haploid sources). Indels in the former class primarily represent errors in finished sequence; they occur at ,20-fold lower frequency (inset) than indels in the latter class, which primarily representpolymorphicdifferences. |