| front |1 |2 |3 |4 |5 |6 |7 |8 |9 |10 |11 |12 |13 |14 |15 |16 |17 |18 |19 |20 |21 |22 |23 |24 |25 |26 |27 |28 |29 |30 |31 |32 |33 |review |
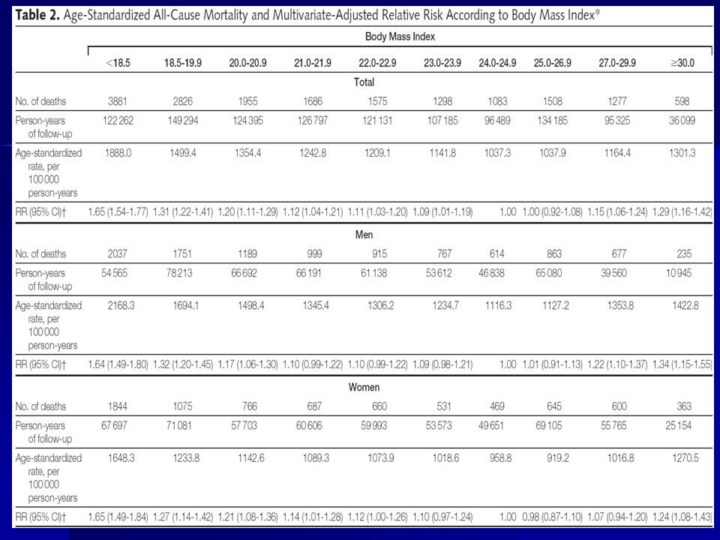 |
There was a statistically significant U-shaped association between body-mass and age-standardized mortality from all-causes with the lowest mortality among study participants with a BMI of 24.0-24.9 in men and 25.0-26.9 in women. This U-shaped association between BMI and all-cause mortality remained after multivariate adjustment for important risk factors including age, gender, cigarette smoking, alcohol consumption, physical activity, education, geographic region and urbanization. For example, the multivariate-adjusted relative risk (95% confidence interval) was 1.64 (1.49, 1.80) and 1.65 (1.49, 1.84) for underweight (BMI <18.5 kg/m2) and 1.34 (1.15, 1.55) and 1.24 (1.08, 1.43) for obesity (body-mass index ≥30.0 kg/m2), in men and women, respectively. |