Search for most updated materials
 |
 |
front |1 |2 |3 |4 |5 |6 |7 |8 |9 |10 |11 |12 |13 |14 |15 |16 |17 |18 |19 |20 |21 |22 |23 |24 |25 |26 |27 |28 |29 |30 |31 |32 |33 |34 |35 |36 |37 |38 |39 |40 |41 |42 |43 |44 |45 |46 |47 |48 |49 |50 |review |
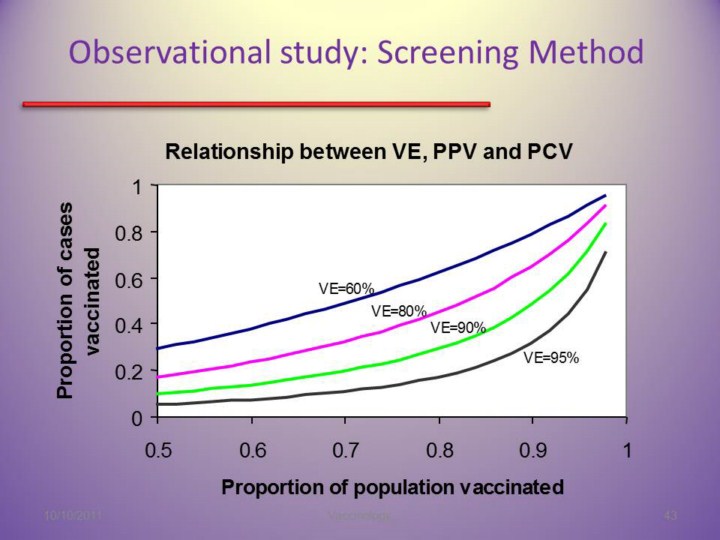 Through a series of curves, the VE is estimated by comparing vaccine uptake amongst cases (PCV) with vaccine uptake in the population (PPV). Generally with higher population coverage, vaccine uptake also increases among cases.
For example : if coverage (PPV) for measles vaccine was thought to be 90% and if 50% of cases in an outbreak had a history of vaccine (PCV) - VE is estimated at 90%. The investigator might conclude that efficacy was not a major problem in the outbreak. However if PPV was 50%, and PCV was 40%, then estimated VE would be below 40% causing more concern. |