| front |1 |2 |3 |4 |5 |6 |7 |8 |9 |10 |11 |12 |13 |14 |15 |16 |17 |18 |19 |20 |21 |22 |23 |24 |25 |review |
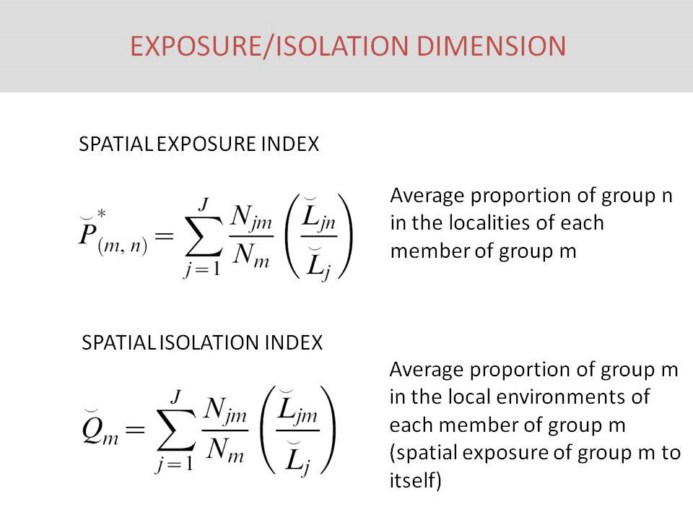 |
So, these are the Feitosa’s indexes in the exposure/isolation dimension. The Spatial Exposure Index is the average proportion of group n in the localities of each member of group m. For example, could be the average proportion of poor people living in the areas where each rich person live. Or the contrary. It may be understood as a proxi for potential social interaction between two different groups.
The Spatial Isolation Index is the average proportion of group m in the local environments of each member of group m. It is a special case of exposure index that measures the spatial exposure of group m to it self. As you can see in the formulas, L, representing the population intensity, is present, and so preventing the checkerboard problem. |